Figure 1. Genome-wide association study Manhattan plots for cataract and age-at-cataract-diagnosis. A: Case-control adjusted by first three principal components and site where eMERGE data was collected. B: Age-at-diagnosis adjusted by first three principal components and site where eMERGE data were collected.
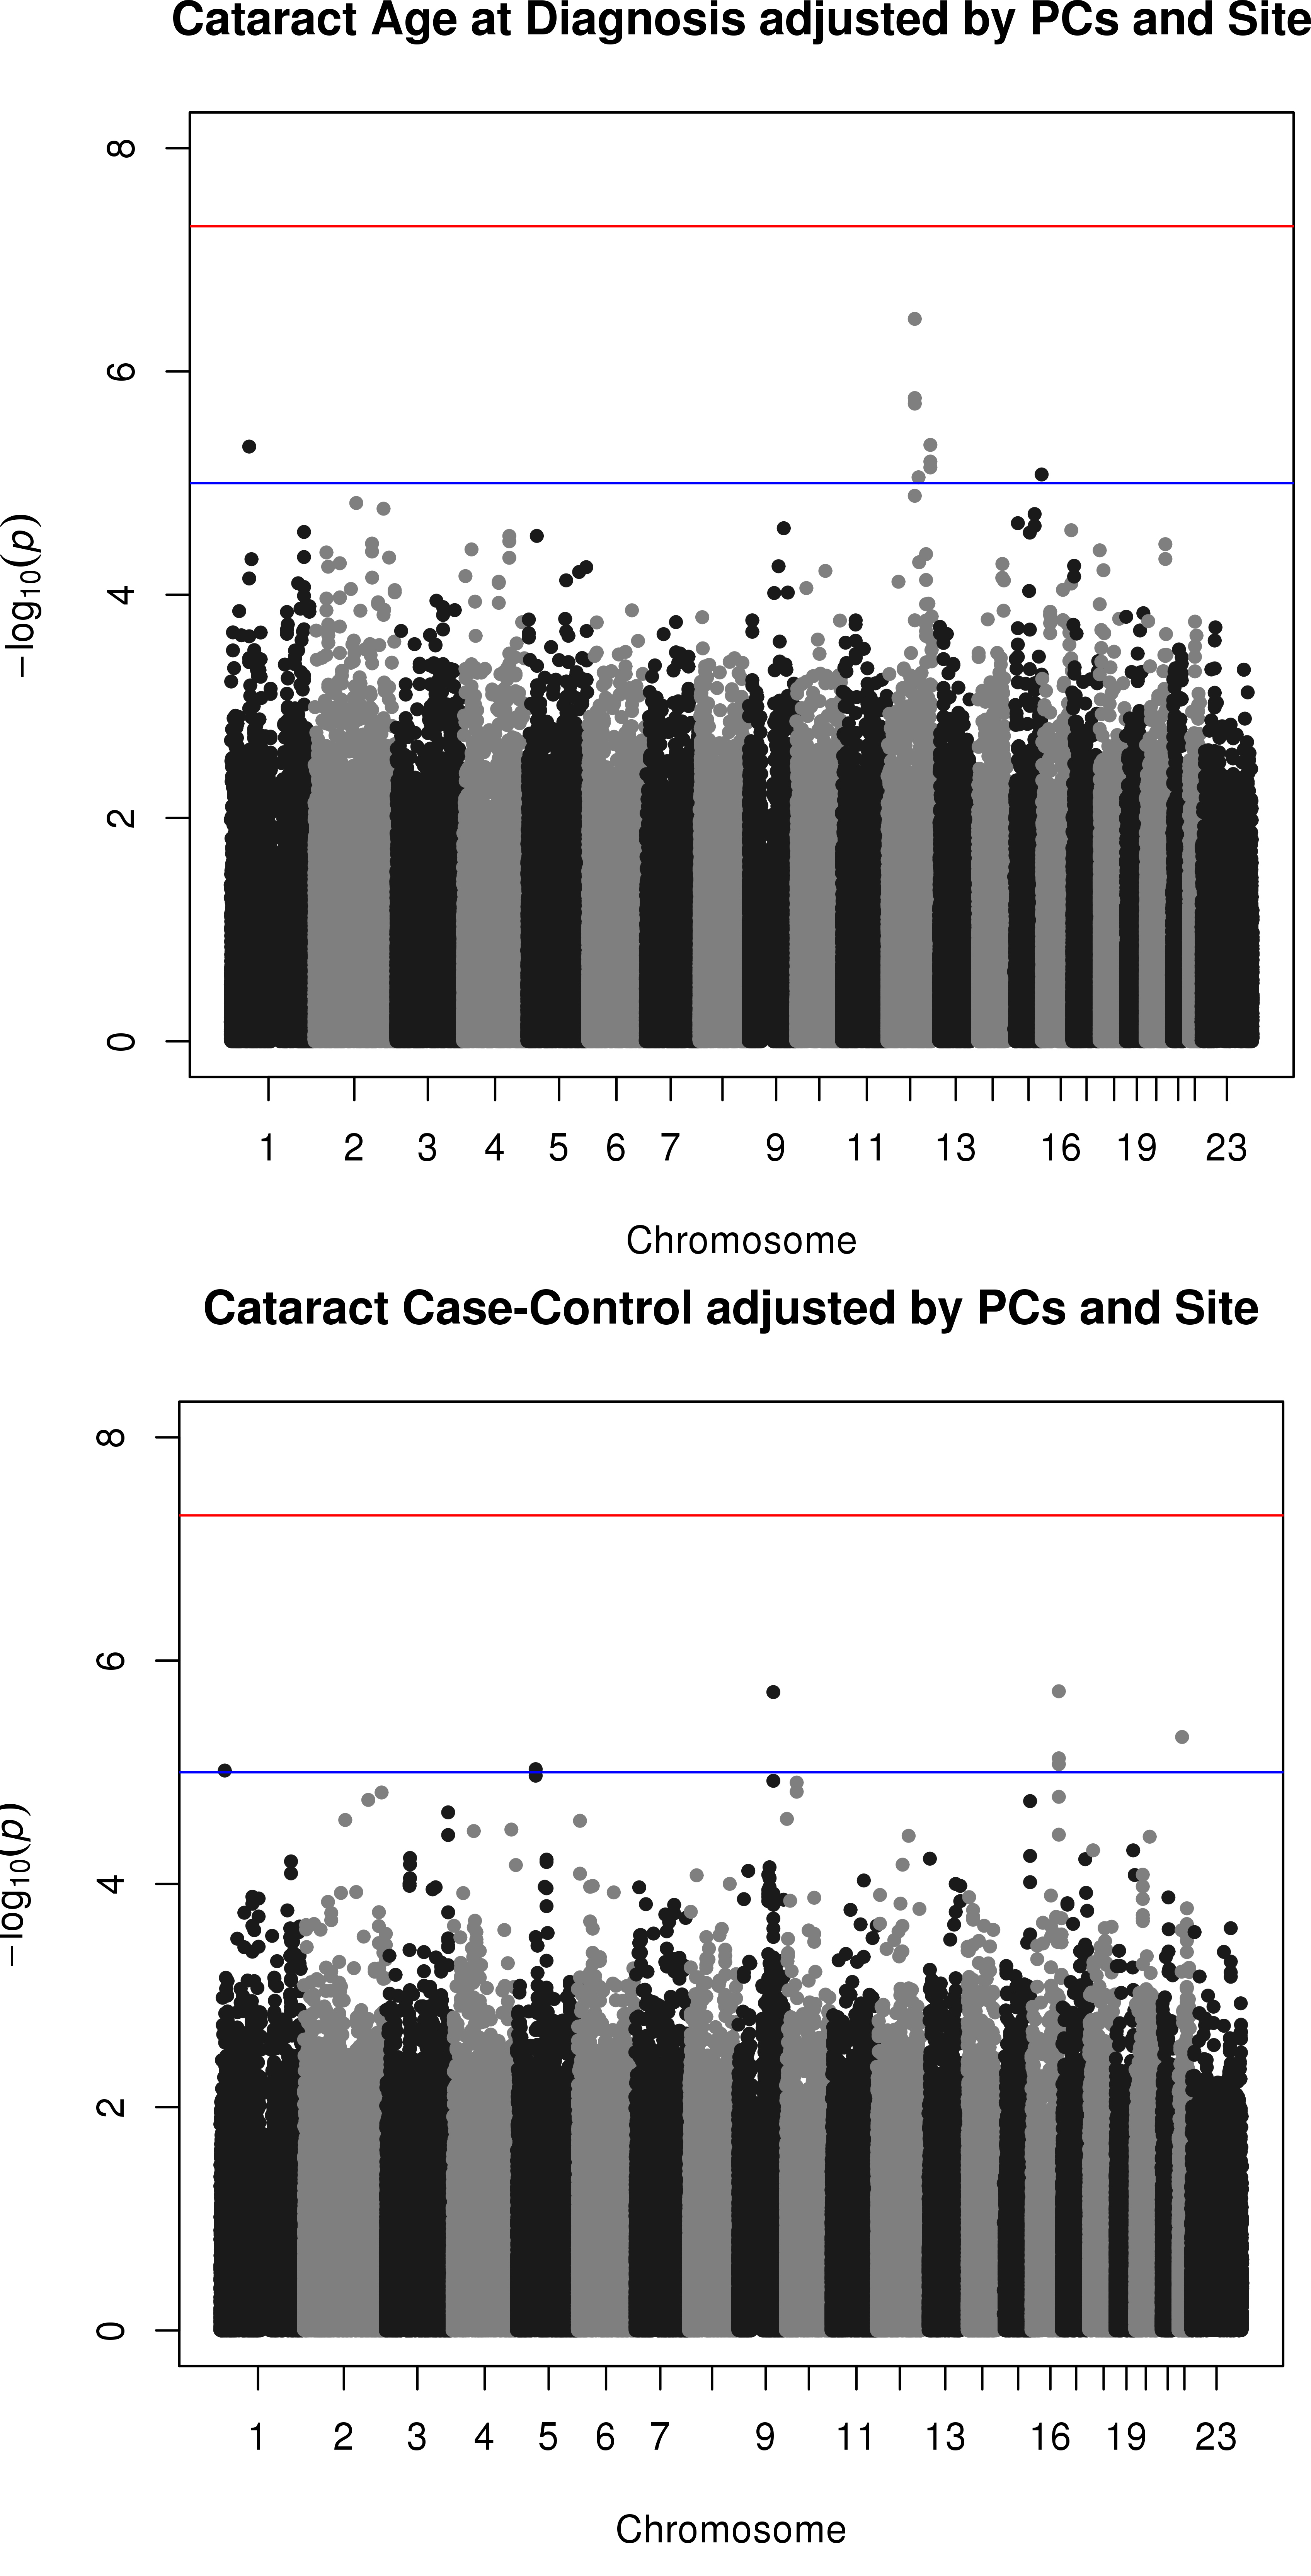
 Figure 1 of
Ritchie, Mol Vis 2014; 20:1281-1295.
Figure 1 of
Ritchie, Mol Vis 2014; 20:1281-1295.