Figure 4. Three weeks after human retinal progenitor cells were injected into the subretinal space in B6 mice. The first row (A, B, C) represents the Cyclosporin A (CsA)-treated group after injection (n=15). The second row (D, E, F) is human retinal progenitor cells (hRPCs) groups as the control (n=15). G: The average number of cells in the subretinal space was counted per microscopic field. The columns are the mean values,
and the error bars are standard deviation (SD). Compared with the control group, the cells in the CsA group survived better,
with most remaining cells in the subretinal space (p<0.05; n = 15). Scale bar = 50 μm. Abbreviations: ganglion cell layer
(GCL); inner nuclear layer (INL); outer nuclear layer (ONL); subretinal space (SRS).
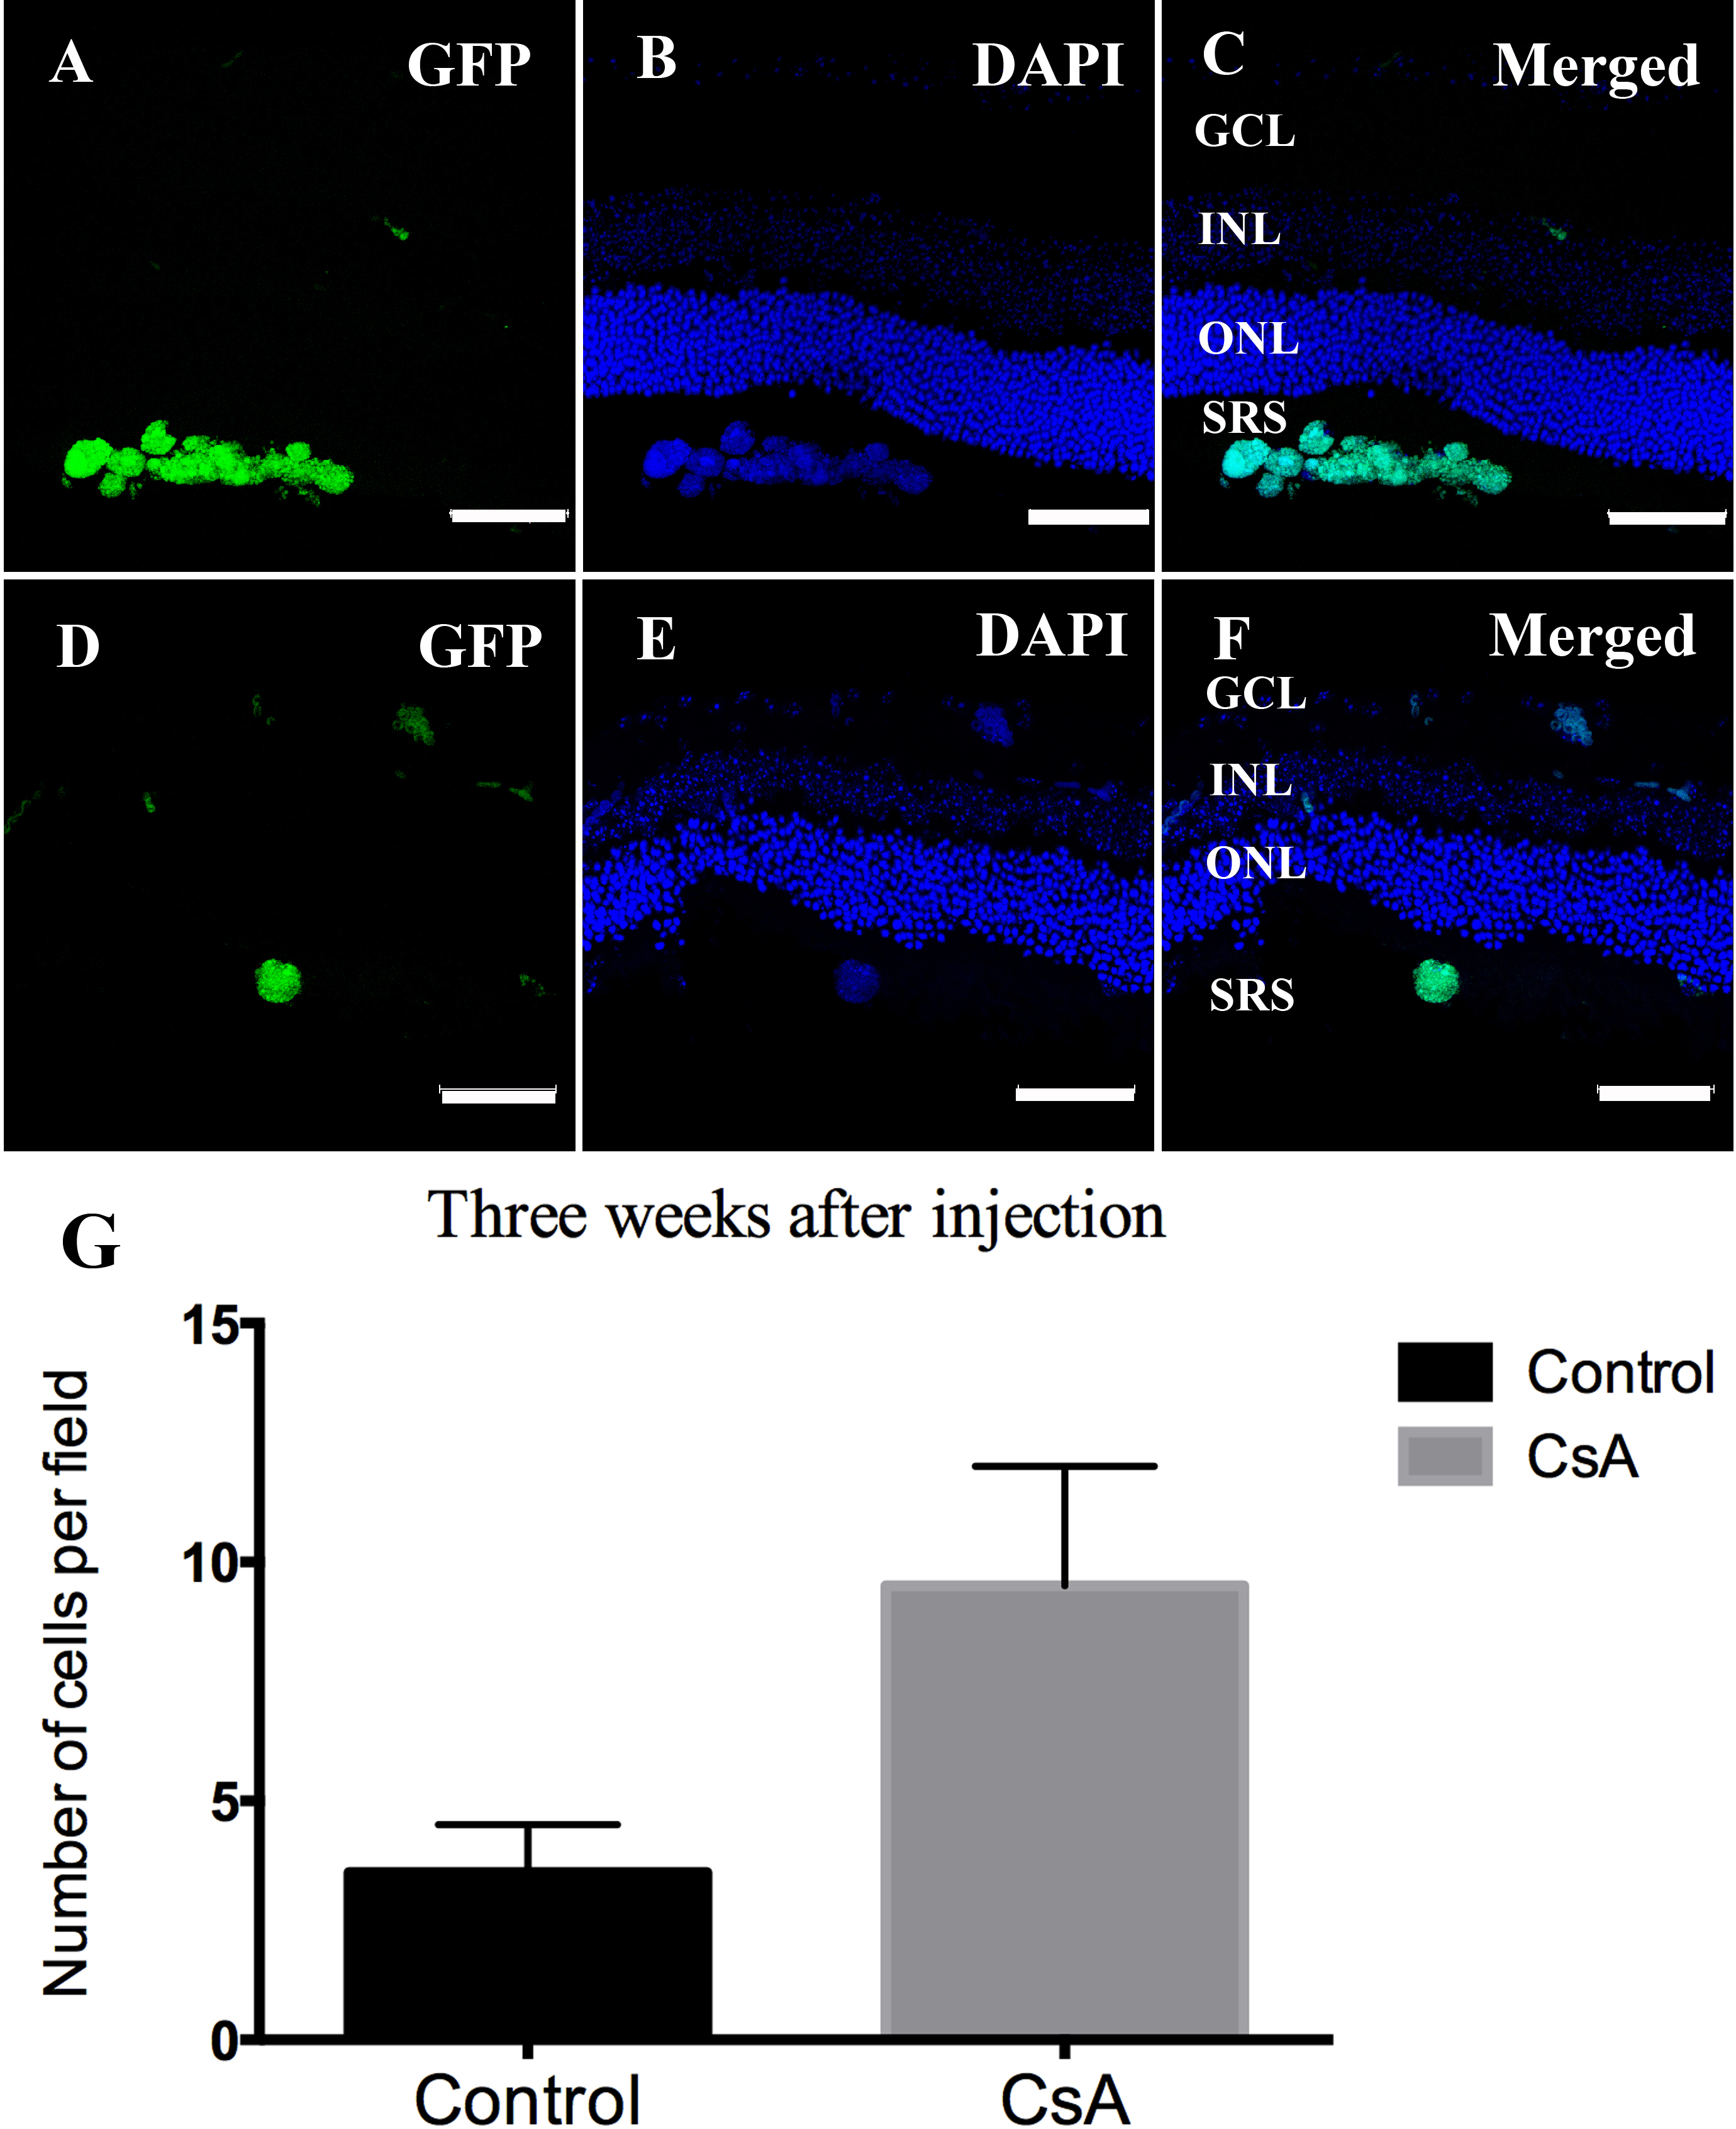
 Figure 4 of
Huang, Mol Vis 2014; 20:1271-1280.
Figure 4 of
Huang, Mol Vis 2014; 20:1271-1280.