Figure 3. Seven days after human retinal progenitor cells were injected into the subretinal space in B6 mice. The first row (A, B, C) shows the Cyclosporin A (CsA)-treated group after injection (n=15). The second row (D, E, F) are the human retinal progenitor cell (hRPC) groups as the control (n=15). G: The average number of cells in the subretinal space was counted per microscopic field. The columns are the mean values,
and the error bars are standard deviation (SD). A cluster of hRPCs remained in the subretinal space, and the survival rate
decreased for both groups, but still showed a difference (p<0.05; n = 15). Scale bar = 50 μm. Abbreviations: outer nuclear
layer (ONL); subretinal space (SRS).
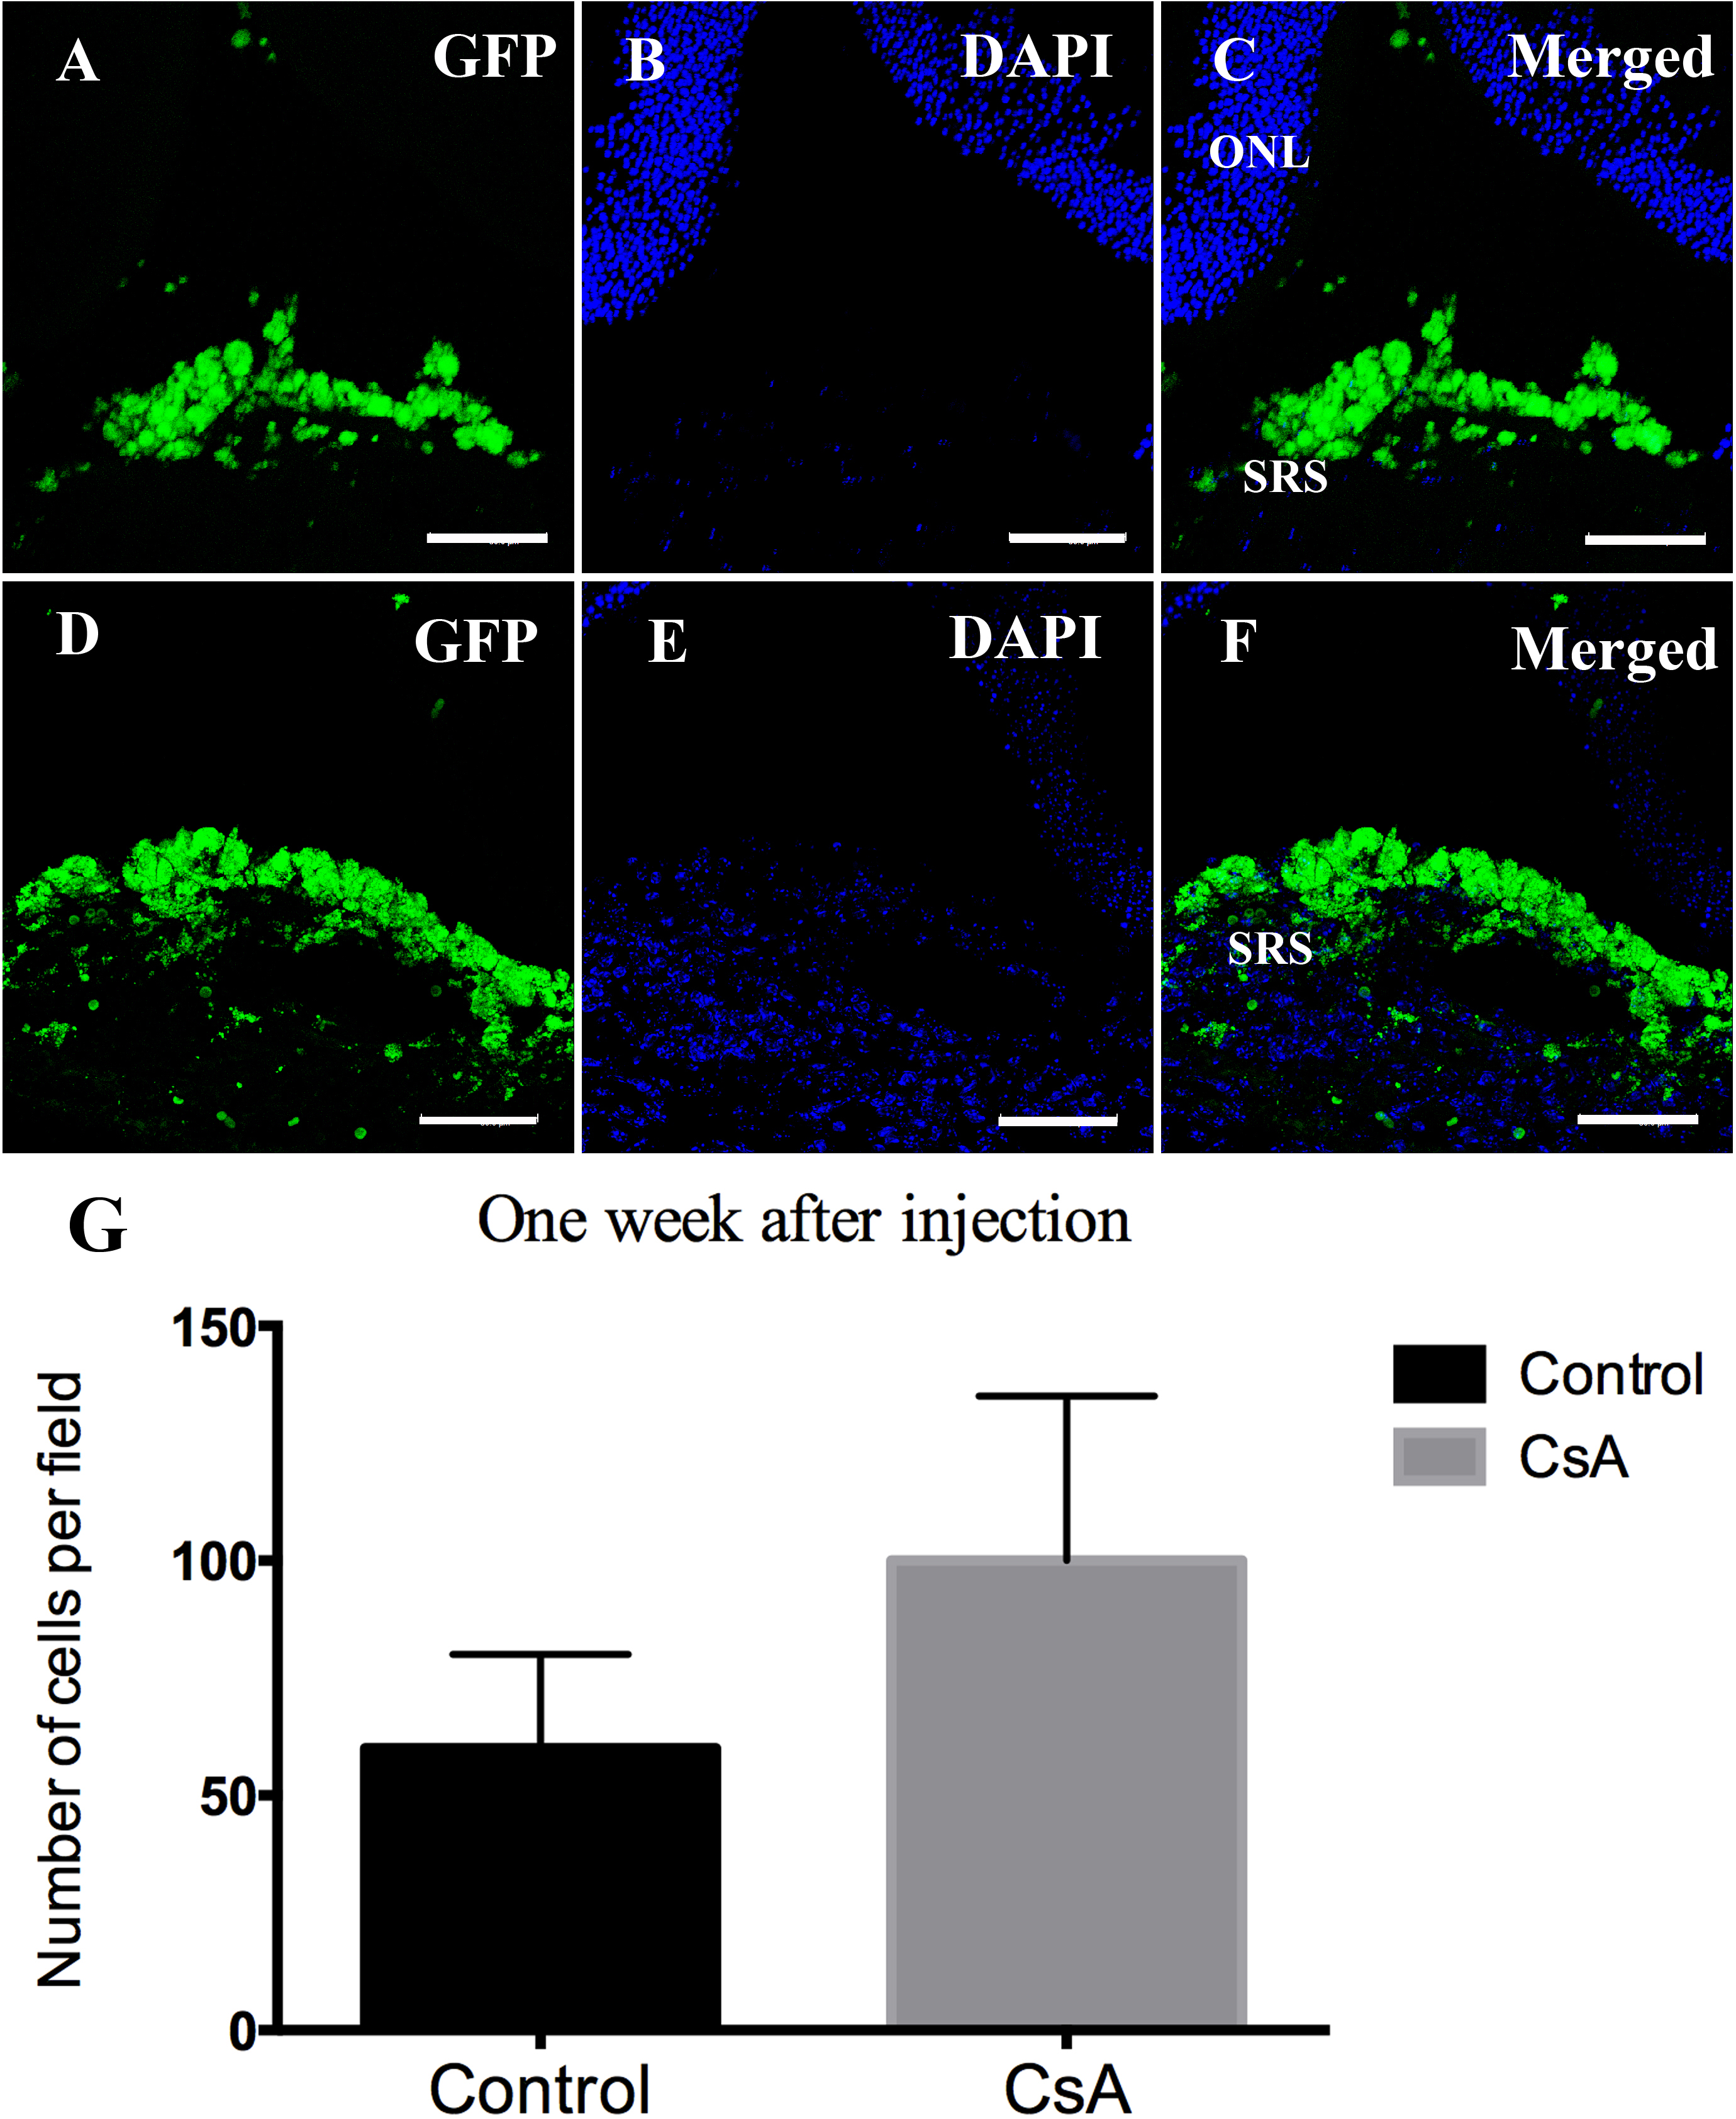
 Figure 3 of
Huang, Mol Vis 2014; 20:1271-1280.
Figure 3 of
Huang, Mol Vis 2014; 20:1271-1280.