Figure 2. Three days after human retinal progenitor cells were injected into the subretinal space in B6 mice. The first row (A, B, C) represents the moment immediately after injection (n=10). The second row (D, E, F) shows the Cyclosporin A (CsA)-treated group (n=15). The third row (G, H, I) is the human retinal progenitor cell (hRPC) groups as the control (n=15). J: The average number of cells in the subretinal space was counted per microscopic field. The columns are the mean values,
and the error bars are standard deviation (SD). * There was no obvious difference between the control group and the CsA group
(p>0.05; n = 15). Scale bar = 50 μm. Abbreviations: outer nuclear layer (ONL); subretinal space (SRS).
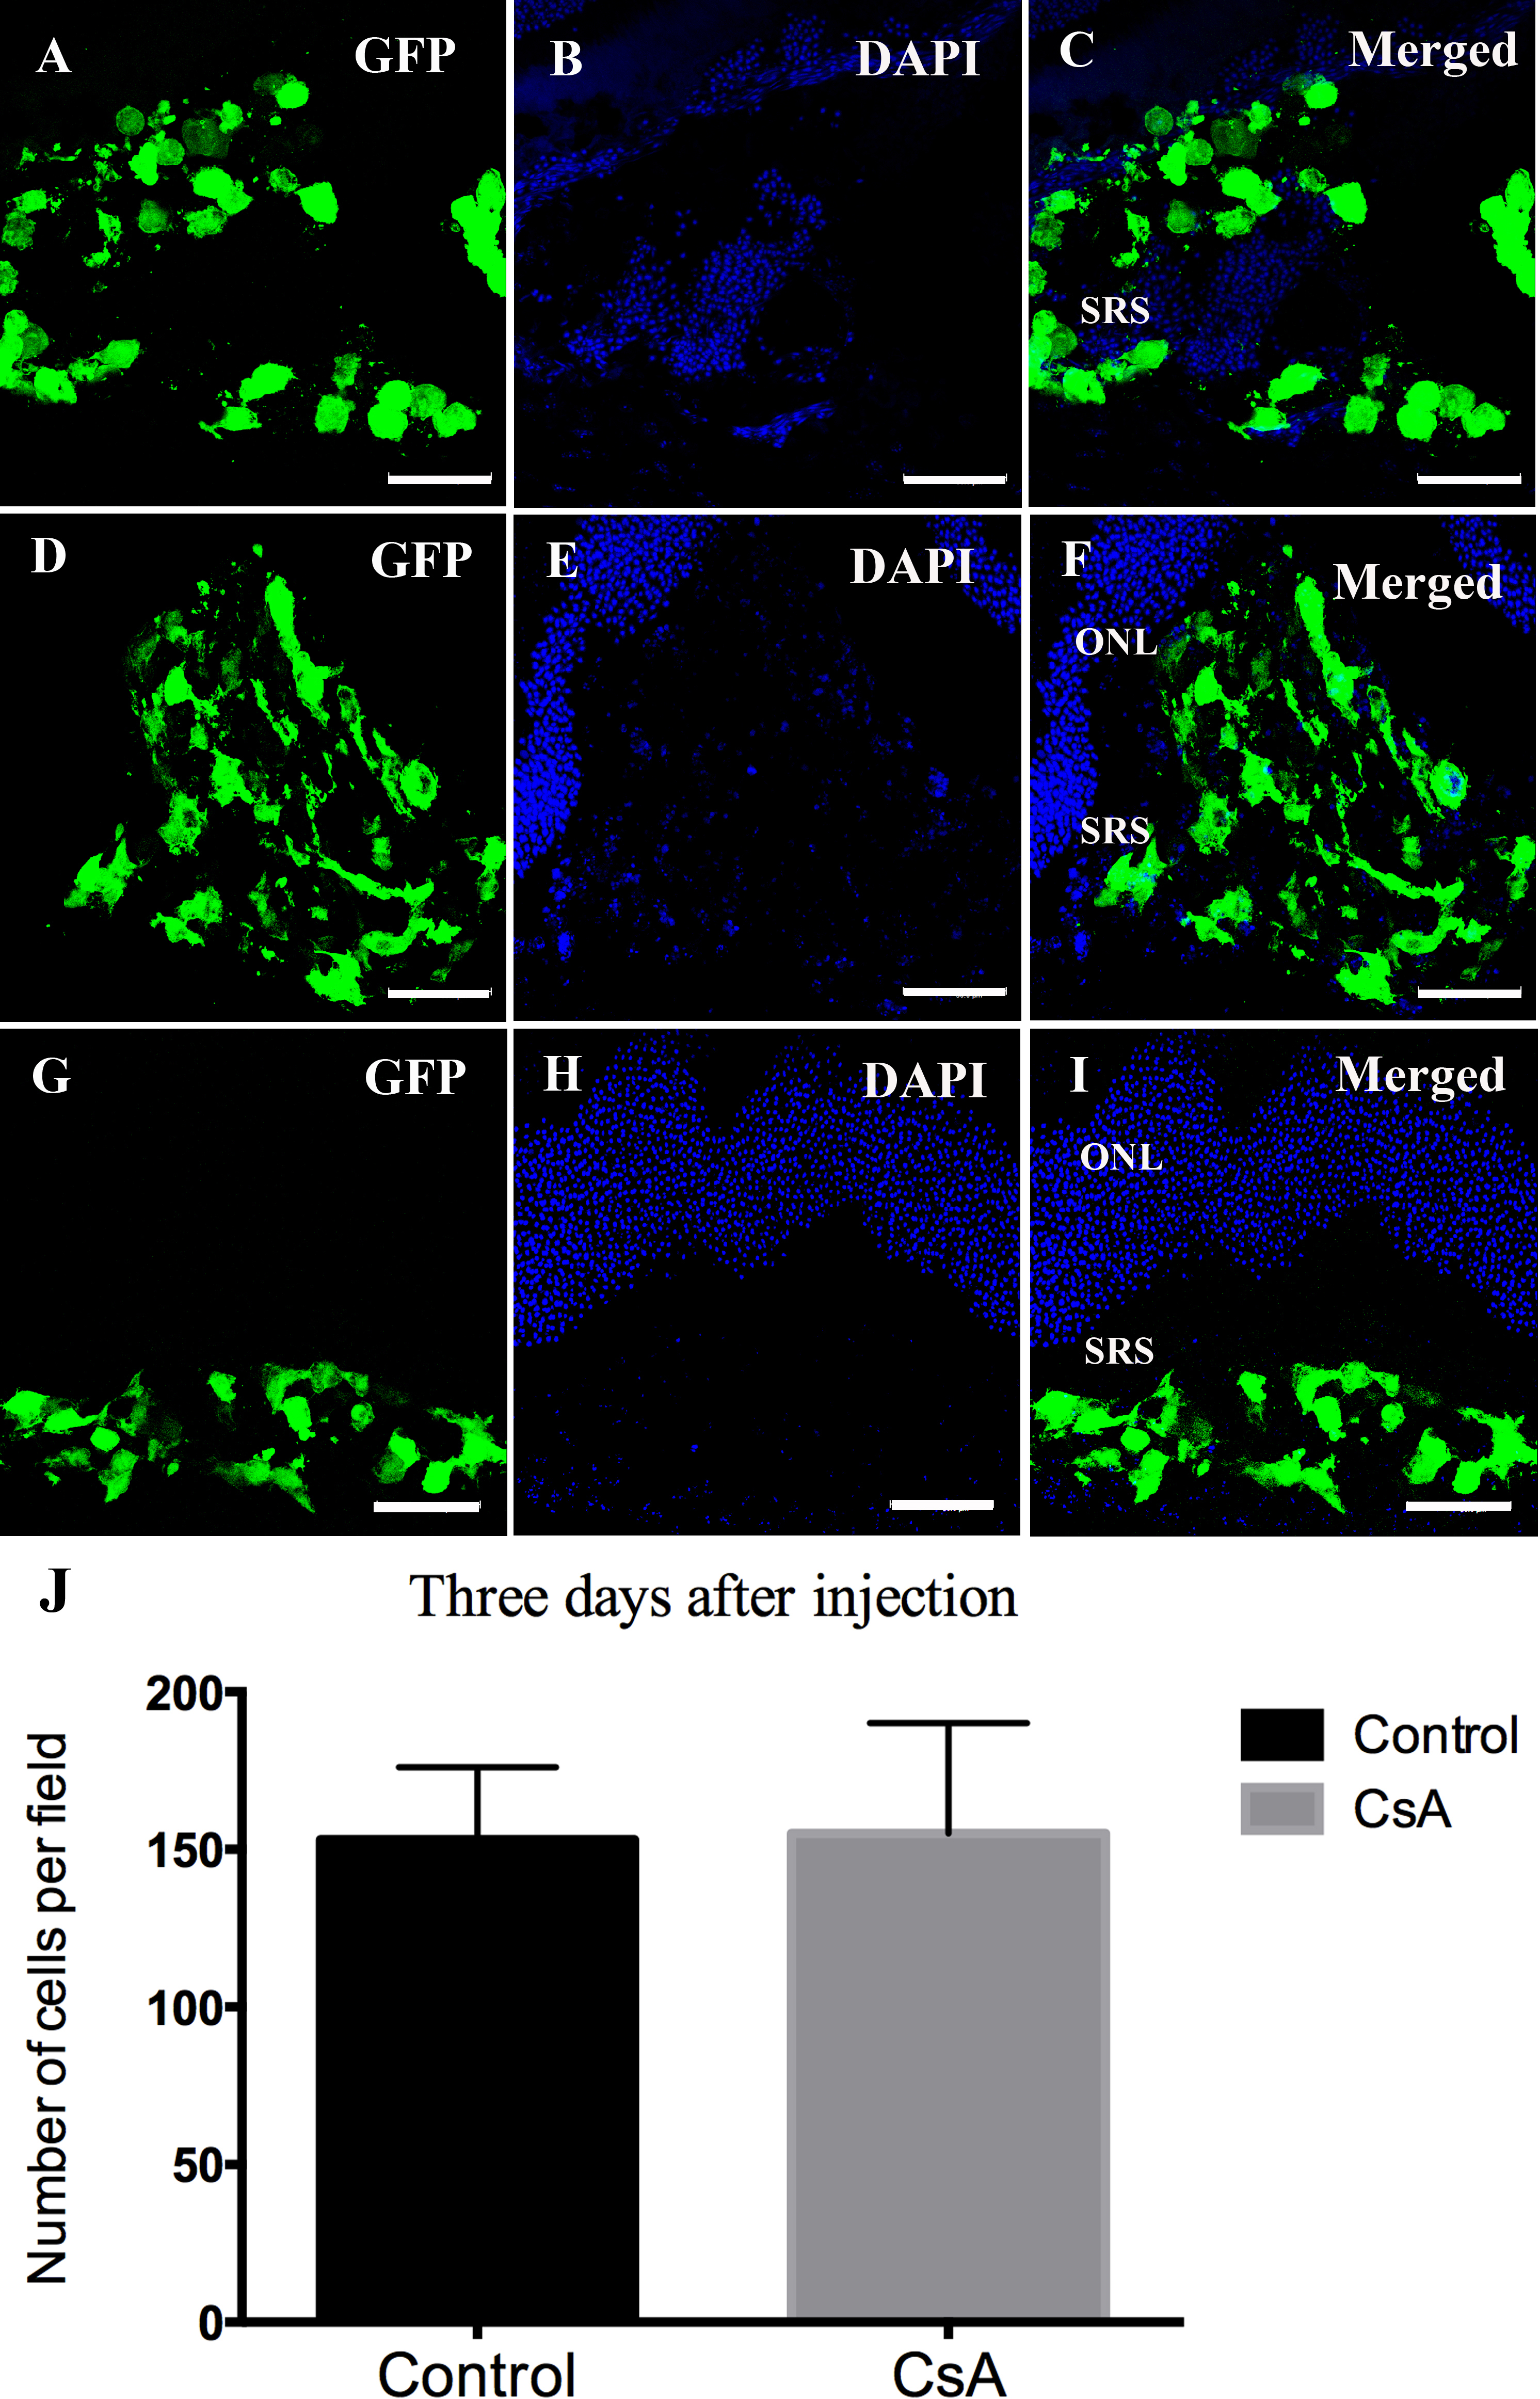
 Figure 2 of
Huang, Mol Vis 2014; 20:1271-1280.
Figure 2 of
Huang, Mol Vis 2014; 20:1271-1280.