Figure 1. Cross-sectional spectral domain optical coherence tomography images for two groups of eyes over a time period of 3 weeks.
The images before the injection (A; n=10) and immediately after the injection (B; n=10) were followed up by scans at 3 days (C, D; n=30), 1 week (E, F; n=30), and 3 weeks (G, H; n=30). The Cyclosporin A (CsA) group (C, E, G; n=45) and the control group (D, F, H; n=45) showed the same trend in changes in the bleb: A distinct bleb with retinal detachment appeared immediately after cell
injection and after 3 days. One week after injection, the initial bleb settled down, but the retinal detachment space was
still evident (arrows in E, F). Three weeks after injection, the retina appeared normal without evident retinal detachment (arrows in G, H). The scale bar is 50 μm.
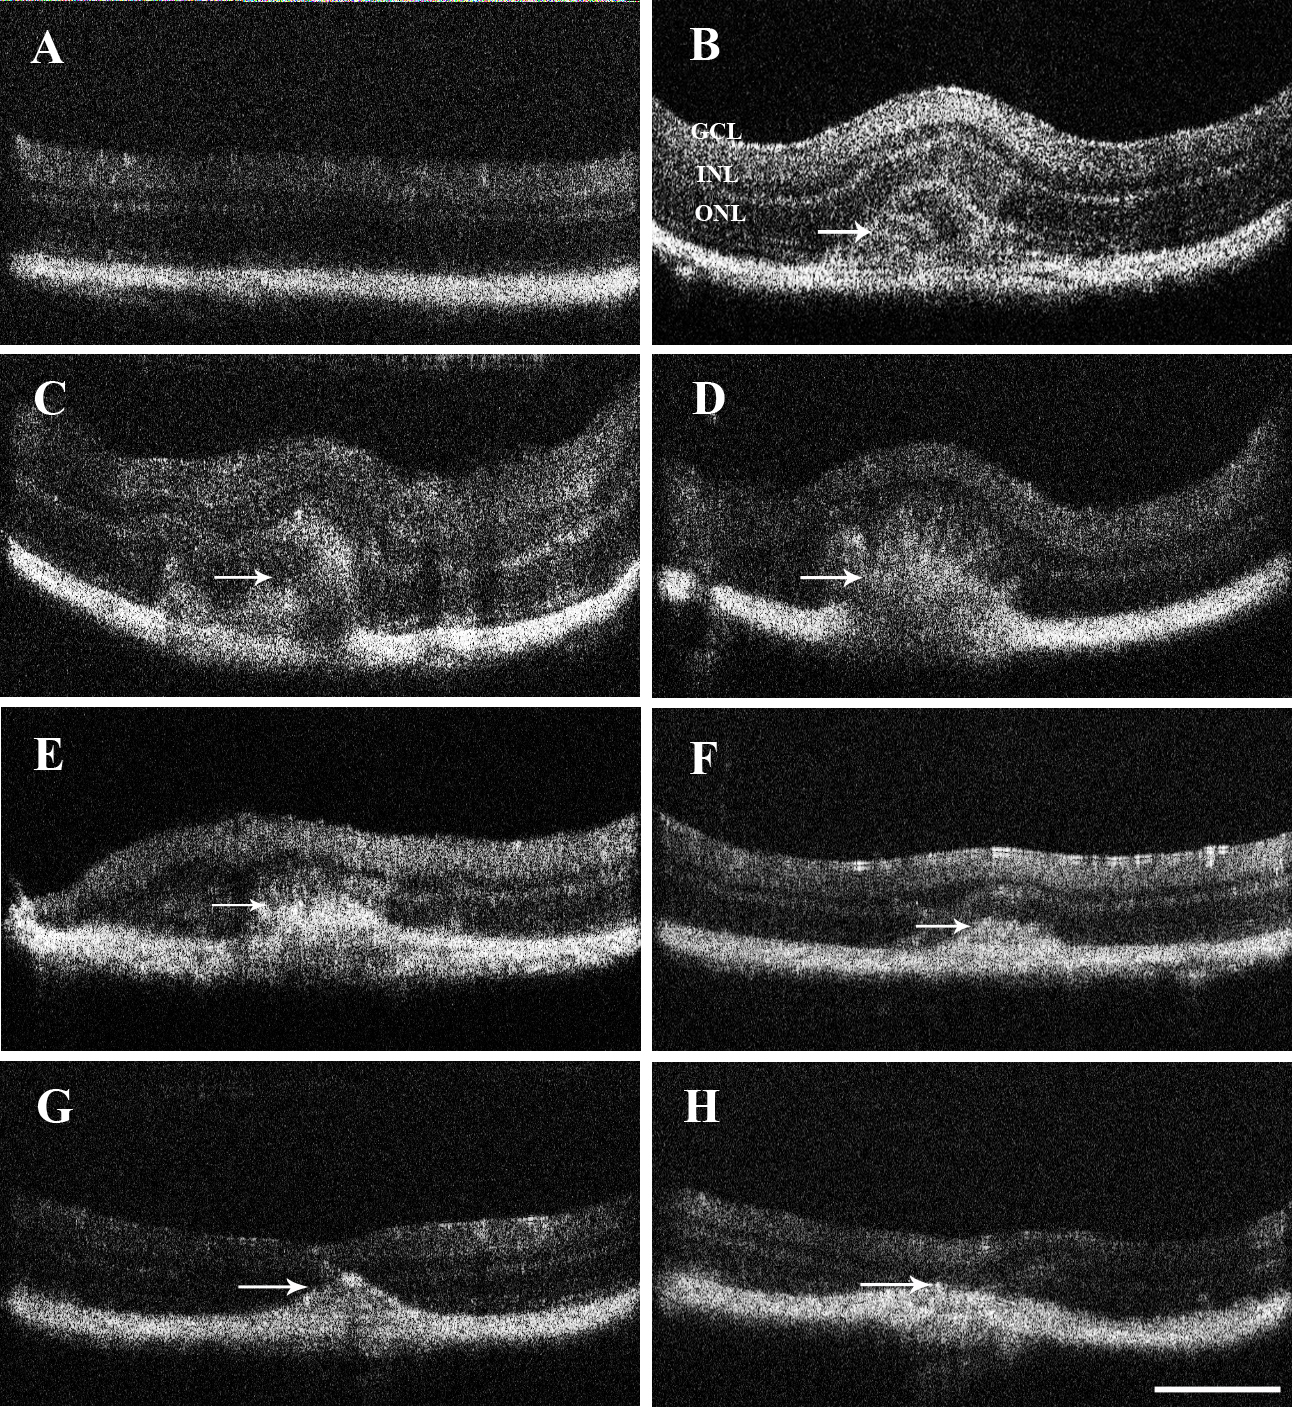
 Figure 1 of
Huang, Mol Vis 2014; 20:1271-1280.
Figure 1 of
Huang, Mol Vis 2014; 20:1271-1280.