Figure 9. The VEGF and TGF-β concentrations in Sema3A-treated retina-choroid complexes. The VEGF and TGF-β1 concentrations in the retina-choroid
complexes were measured using an ELISA kit. The statistical analysis of the free VEGF and TGF-β measured at 14 days after
Sema3A treatment is presented. Each experiment was repeated at least three times. The data are presented as the means±SEM.
*p<0.05; **p<0.01.
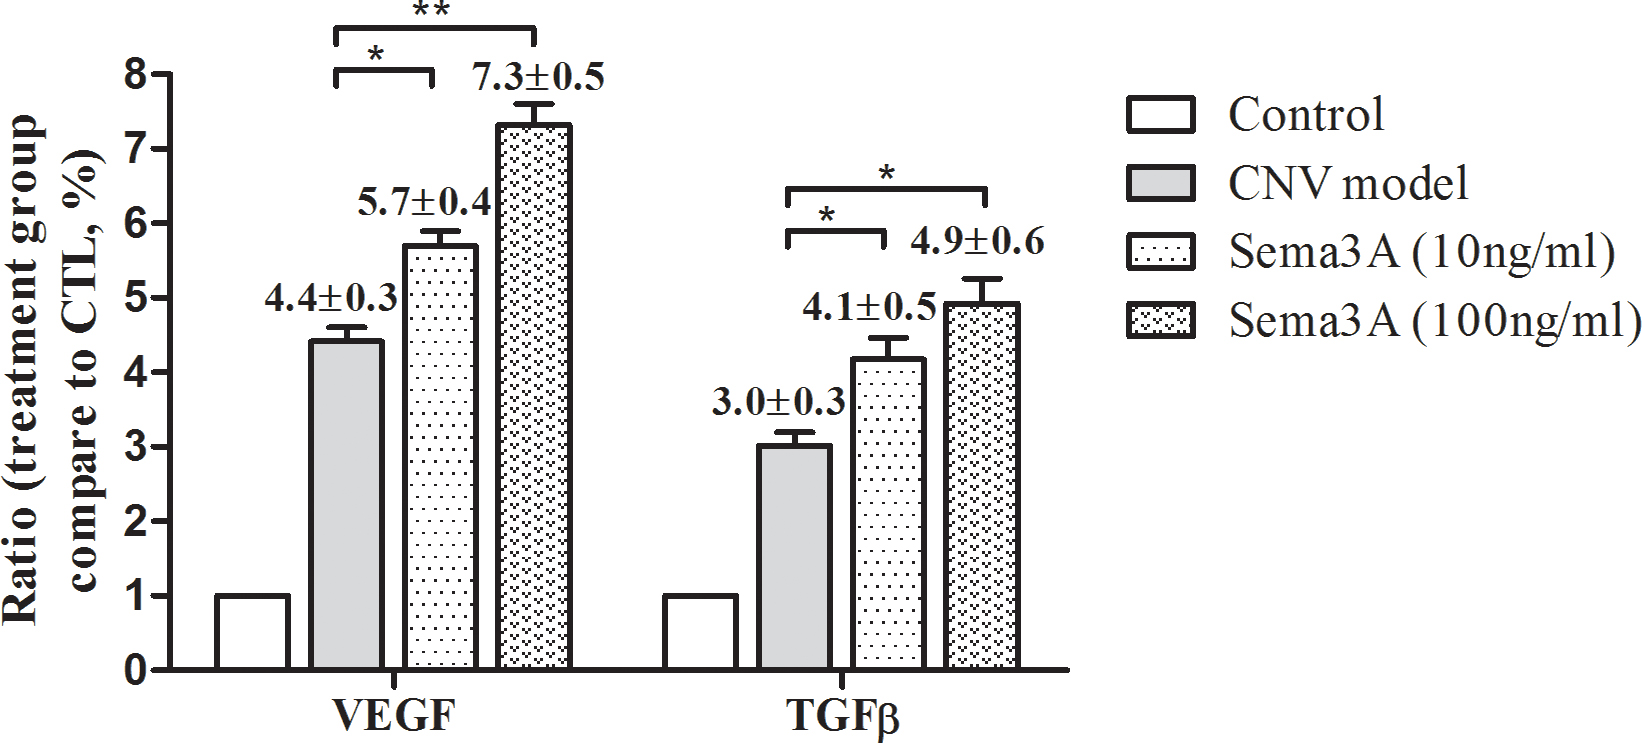
 Figure 9 of
Bai, Mol Vis 2014; 20:1258-1270.
Figure 9 of
Bai, Mol Vis 2014; 20:1258-1270.