Figure 8. CNV leakage with FA assessment of the CNV mouse retina. Angiographic analysis of CNV leakage 14 days after laser photocoagulation
in the different treatment groups and in the control group. A: The normal control. B: The CNV control. C: The Sema3A (10 ng/ml)-treated group. D: The Sema3A (100 ng/ml)-treated group. E: The results and the statistical analysis of the CNV leakage by FA. The data are presented as the means±SEM. *p<0.05; **p<0.01.
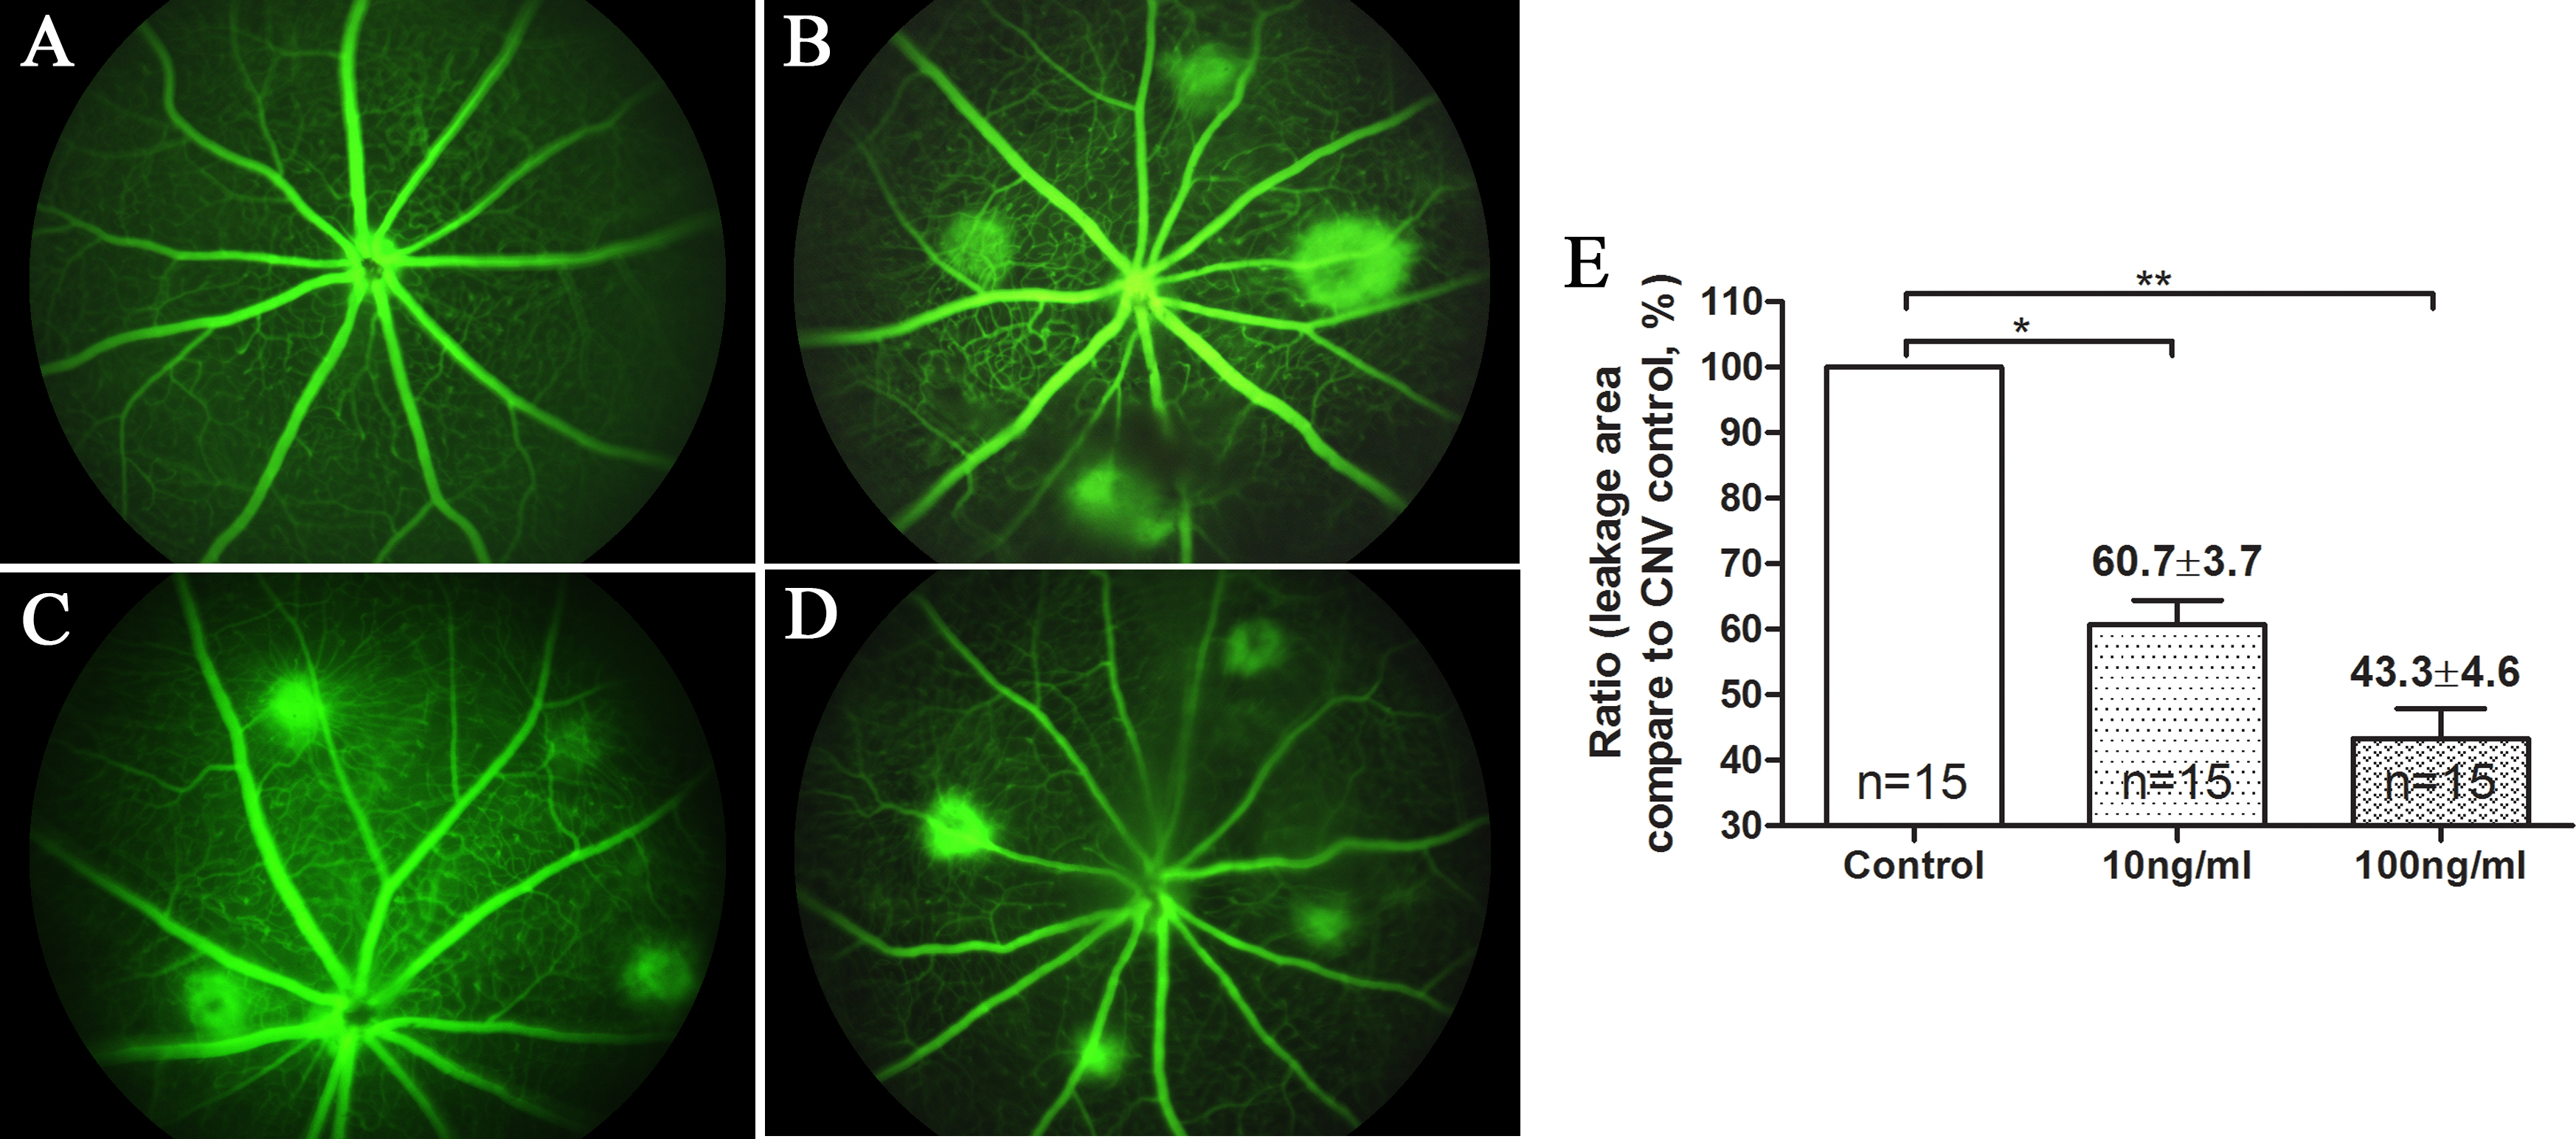
 Figure 8 of
Bai, Mol Vis 2014; 20:1258-1270.
Figure 8 of
Bai, Mol Vis 2014; 20:1258-1270.