Figure 7. TGF-β expression in the CNV mouse model. A: The expression of TGF-β in a real-time PCR array. TGF-β expression is upregulated significantly 14 days after the CNV lesion.
B: The immunoblot image shows that TGF-β is overexpressed. C: The statistical analysis of the western blot results. The real-time PCR and western blot analyses were repeated three times,
and qualitatively similar results were obtained. The data are presented as the means±SEM. *p<0.05; **p<0.01.
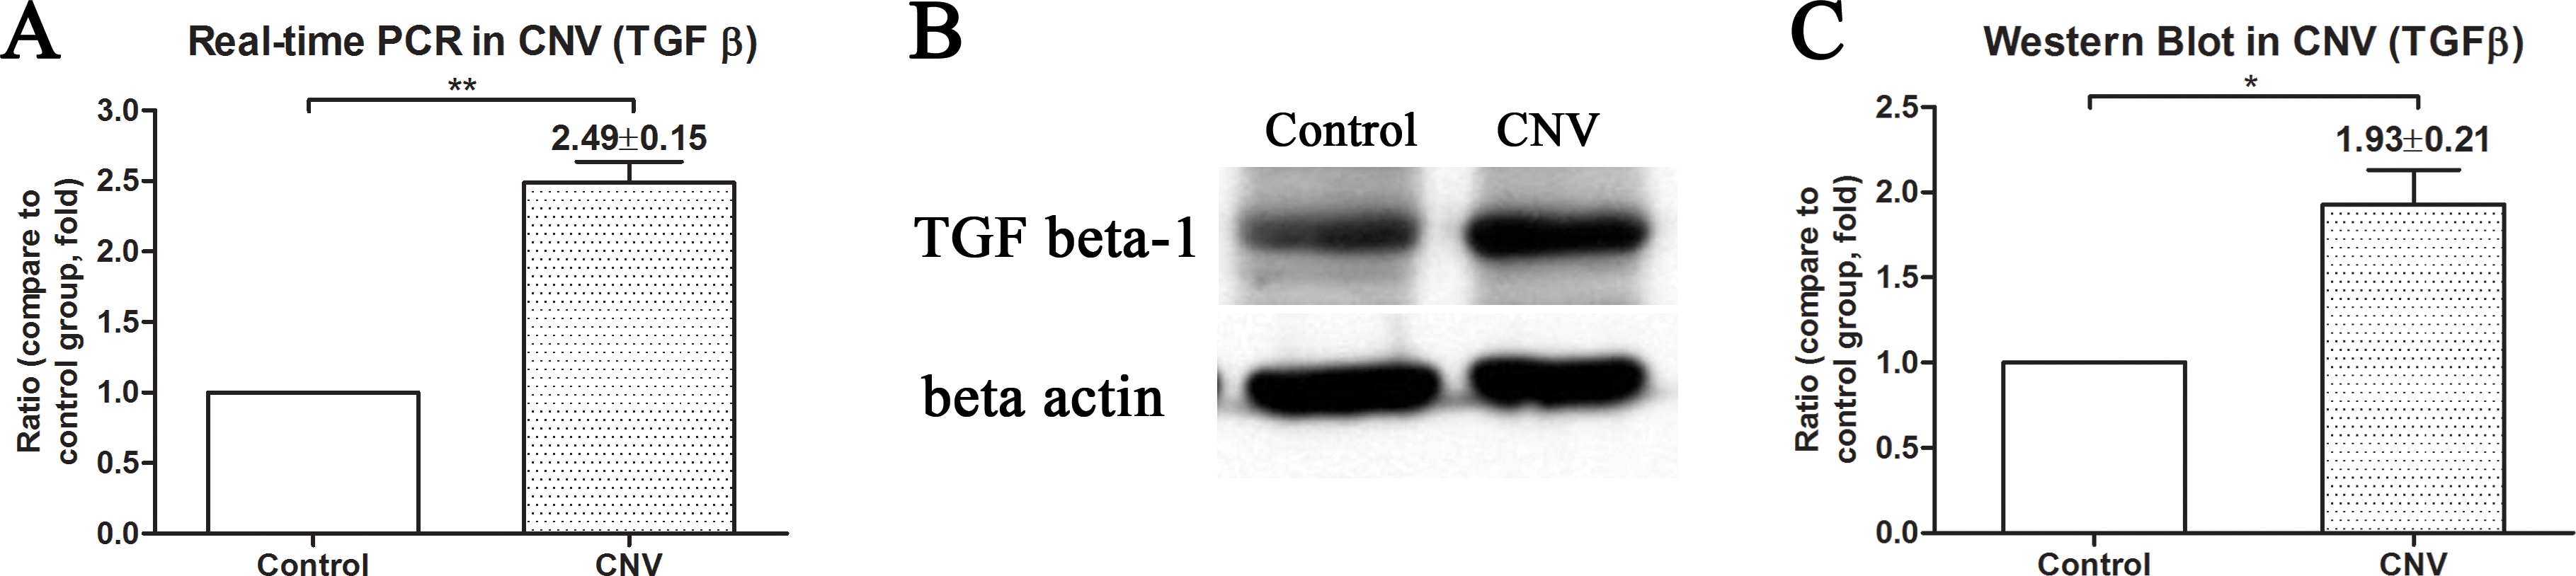
 Figure 7 of
Bai, Mol Vis 2014; 20:1258-1270.
Figure 7 of
Bai, Mol Vis 2014; 20:1258-1270.