Figure 4. Effect of Sema3A on HUVEC apoptosis. Sema3A induced HUVEC apoptosis in the general culture medium and in the TGF-β-stimulated
conditions. FITC-Annexin V staining was measured at the treatment time points of 24, 48, and 72 h. A: Statistical analysis of the HUVEC apoptosis study. B: Representative image of the 1% FBS-treated group. C: Representative image of the TGF-β-treated group. D: Representative image of the Sema3A (250 ng/ml)-treated group. E: Representative image of the Sema3A (500 ng/ml)-treated group. F: Representative image of the Sema3A (250 ng/ml)- and TGF-β-treated groups. G: Representative image of the Sema3A (500 ng/ml)- and TGF-β-treated groups. UR=late apoptotic cells; LR=early apoptotic cells;
UR+LR=total apoptotic cells. The experiment was repeated at least three times. The data are presented as the means±SEM. *p<0.05;
**p<0.01.
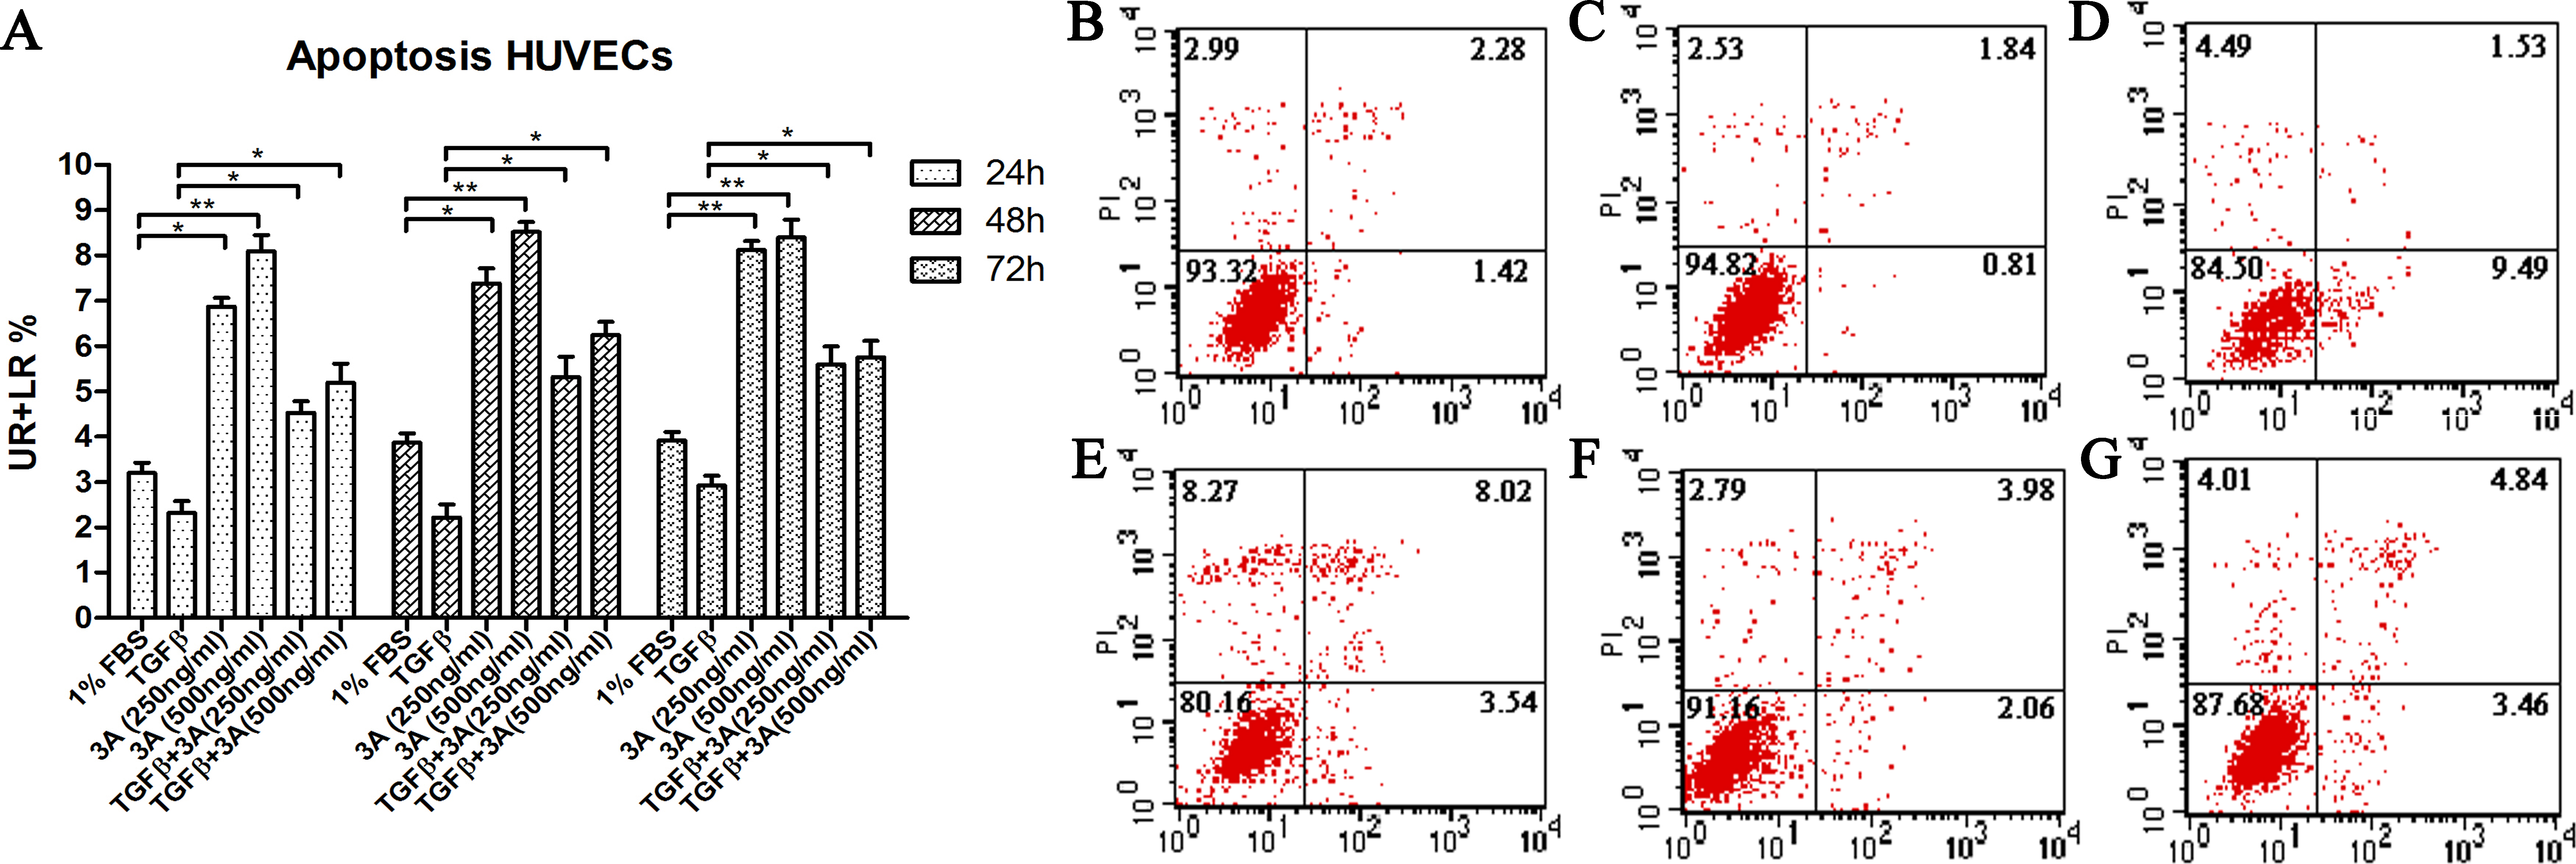
 Figure 4 of
Bai, Mol Vis 2014; 20:1258-1270.
Figure 4 of
Bai, Mol Vis 2014; 20:1258-1270.