Figure 3. The effect of Sema3A on HUVEC migration. The cell nuclei, which were stained with DAPI, are shown as blue dots. The cells
from five random fields were counted, and the average was used for the statistical analysis. A: Statistical analysis of the HUVEC migration study. Sema3A inhibits HUVEC migration in the general culture medium and in
VEGF-stimulated conditions. B: 1% FBS-treated group. C: TGF-β-treated group. D: Sema3A (250 ng/ml)-treated group; E: Sema3A (500 ng/ml)-treated group. F: Sema3A (250 ng/ml)- and TGF-β-treated groups. G: Sema3A (500 ng/ml)- and TGF-β-treated groups. CTL represents the control group. *p<0.05; **p<0.01; ***p<0.0001.
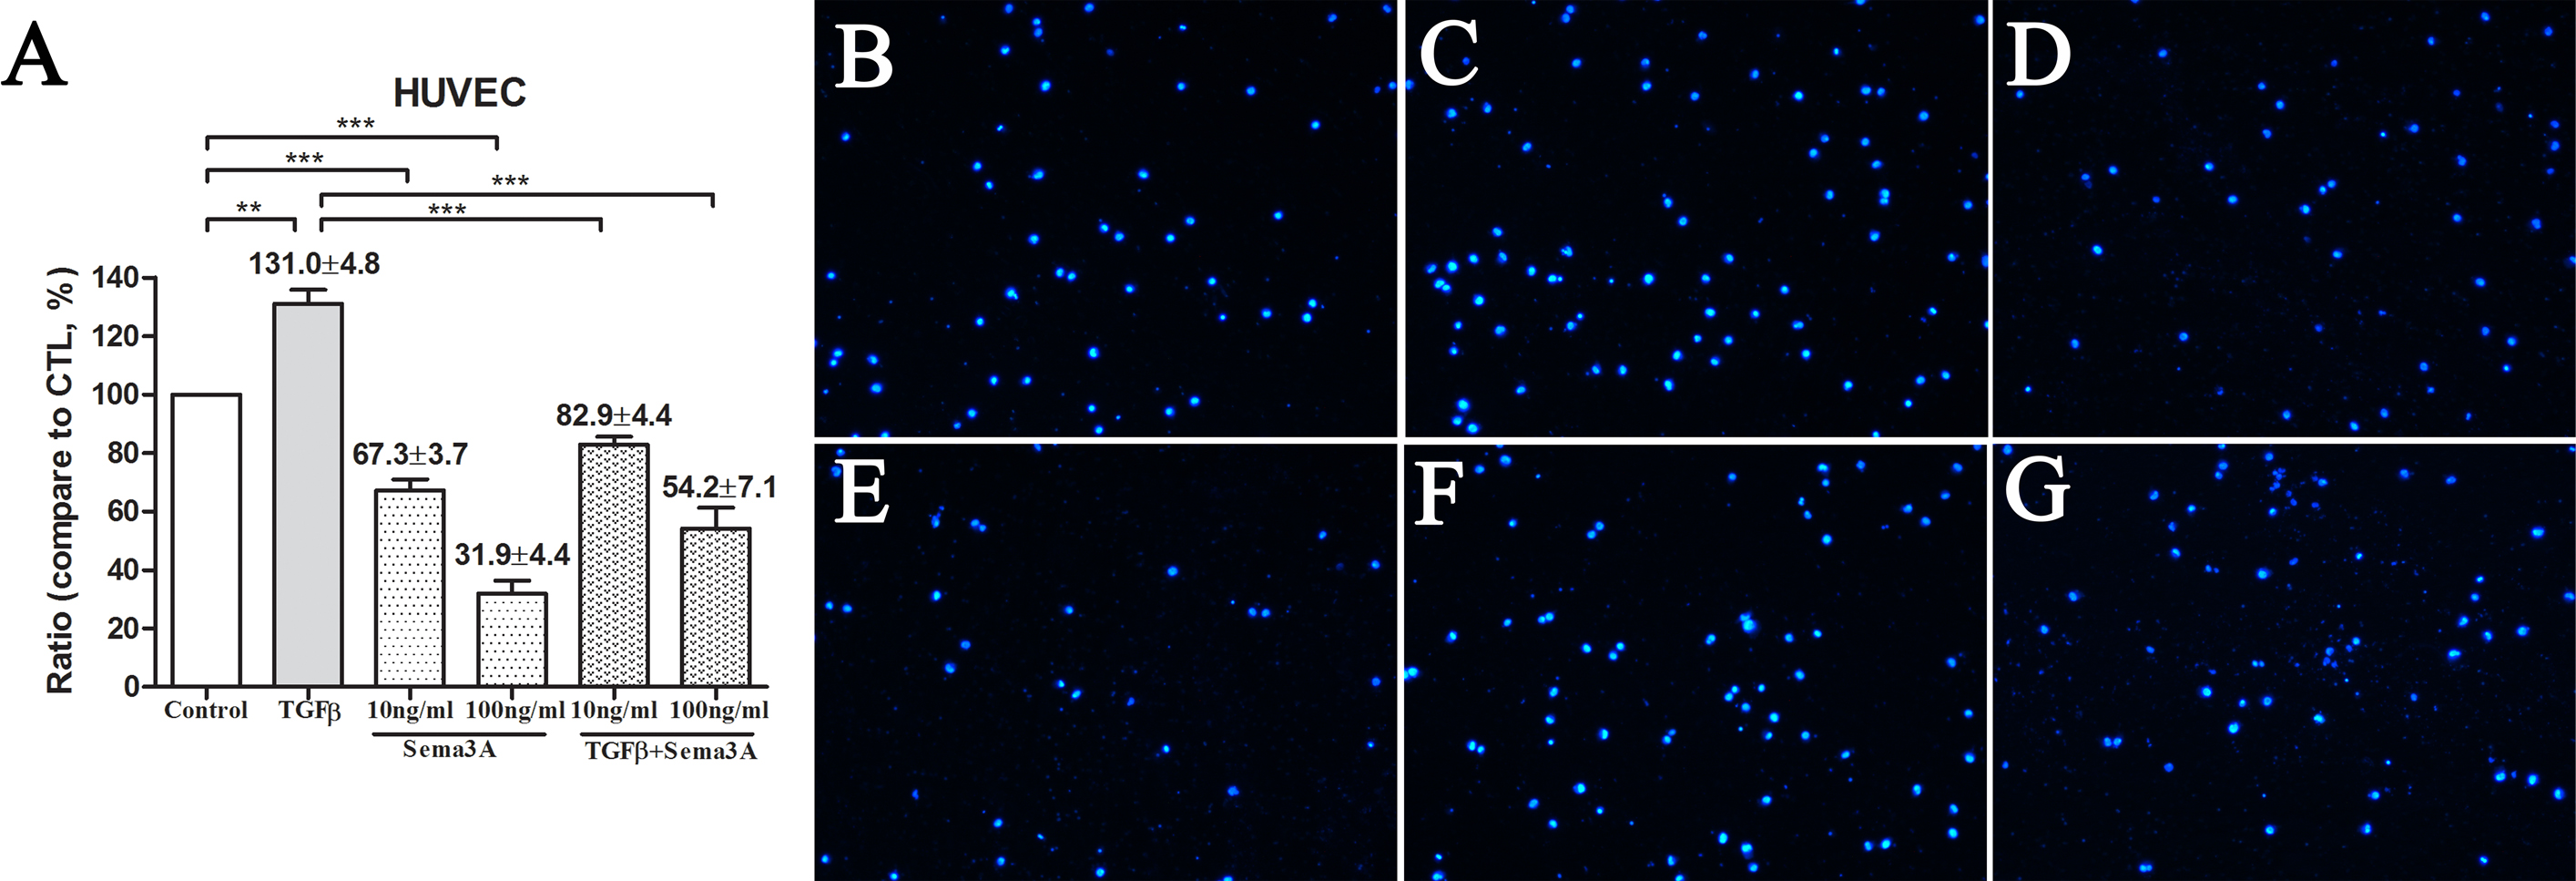
 Figure 3 of
Bai, Mol Vis 2014; 20:1258-1270.
Figure 3 of
Bai, Mol Vis 2014; 20:1258-1270.