Figure 10. Effect of Sema3A on SMAD2/3 and phosphorylated SMAD2/3 in HUVECs and in the CNV mouse model. Immunoblot images (A, D) and statistical analyses (B, C, E, and F) for the SMAD2/3 and p-SMAD2/3 signaling pathways. The results show that Sema3A inhibits SMAD2/3 and p-SMAD2/3 in HUVECs
and in the CNV mouse model. The western blot analyses were repeated three times, and qualitatively similar results were obtained.
The data are presented as the means±SEM. *p<0.05; **p<0.01.
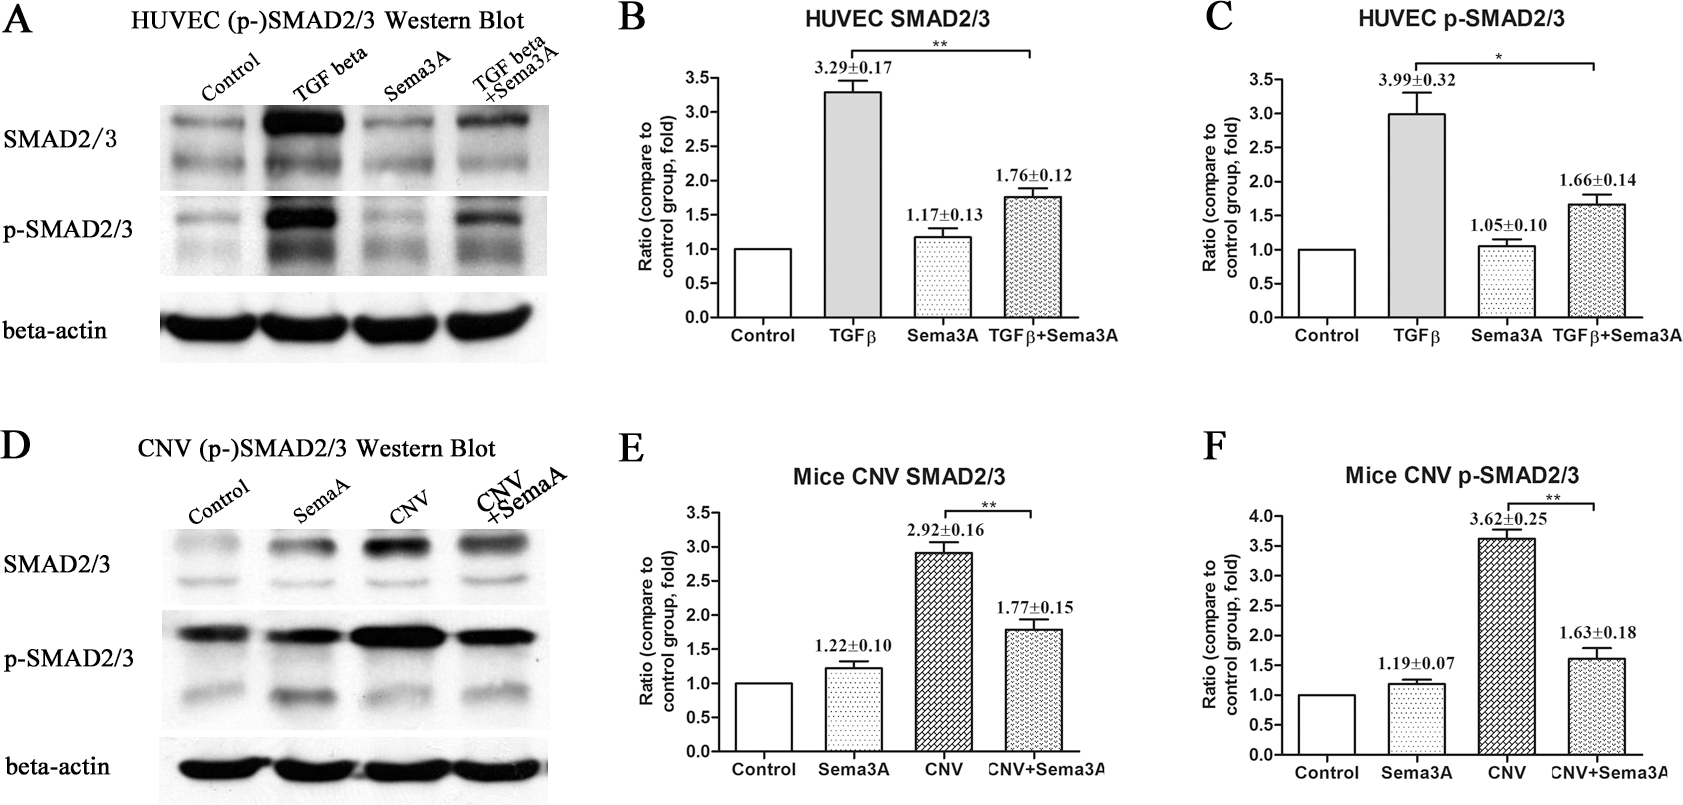
 Figure 10 of
Bai, Mol Vis 2014; 20:1258-1270.
Figure 10 of
Bai, Mol Vis 2014; 20:1258-1270.