Figure 1. The vitreous concentrations of TGF-β in patients with nAMD. The boxplots show the vitreous concentrations of TGF-β in nAMD
eyes and in the controls with IMH. The TGF-β levels were significantly different between the two groups (nAMD compared with
IMH, p=0.0003) nAMD (n=14) vs IMH (n=12), **p<0.01, error bars are SEM.
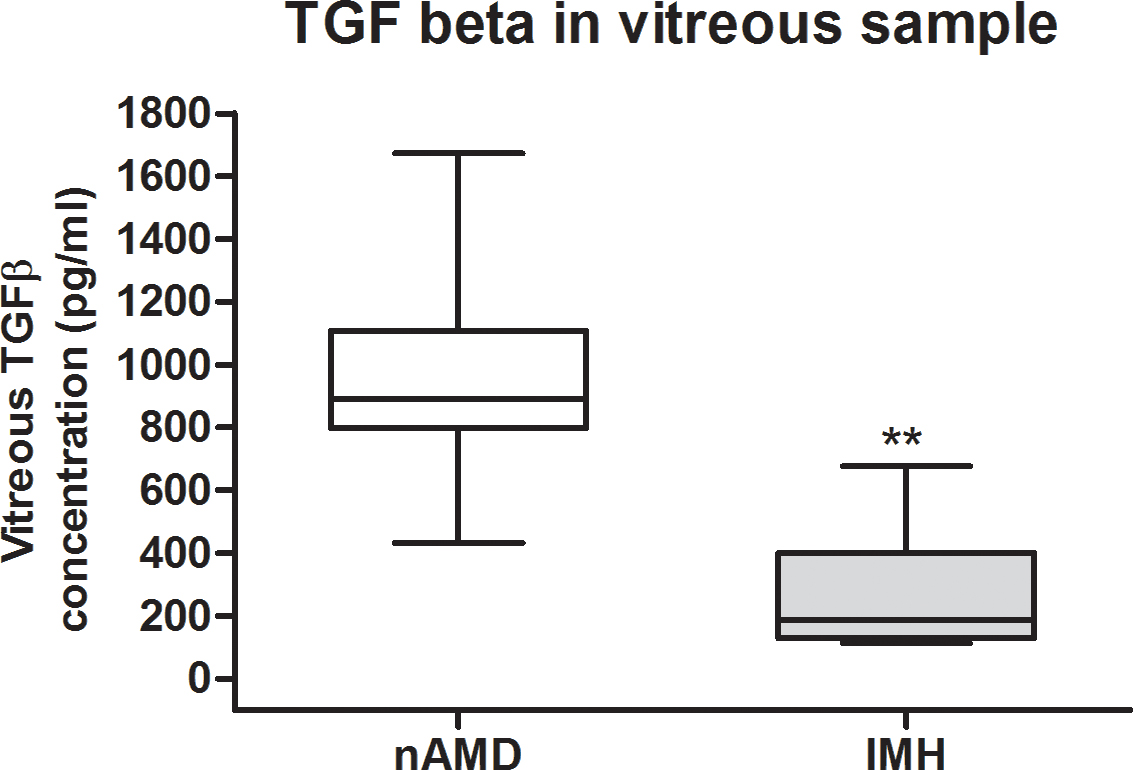
 Figure 1 of
Bai, Mol Vis 2014; 20:1258-1270.
Figure 1 of
Bai, Mol Vis 2014; 20:1258-1270.