Figure 3. Vitreous fluid samples obtained from PDR and control patients (C) were separated by 10% SDS-PAGE, and proteins in the resultant
gel were visualized by Coomassie brilliant blue staining (panel A). The top arrow represents collagen type II (molecular weight approximately 72 kDa) and the lower arrow represents albumin
(molecular weight approximately 66 kDa). The intensity of the protein staining of collagen type II was quantitated by densitometry
of eight PDR and eight control samples. The resultant data are presented in the histograms as mean ± standard deviation and
they were comparable for both groups. The levels of S100A4 and OPN in vitreous samples from patients with PDR and from control
patients without diabetes (C) were determined by western blot analysis (panel B). A representative set of samples is shown. The expressions of S100A4 and both intact and cleaved OPN are significantly increased
in vitreous samples from PDR patients compared to control patients without diabetes. *The difference between the two means
was statistically significant at the 5% level.
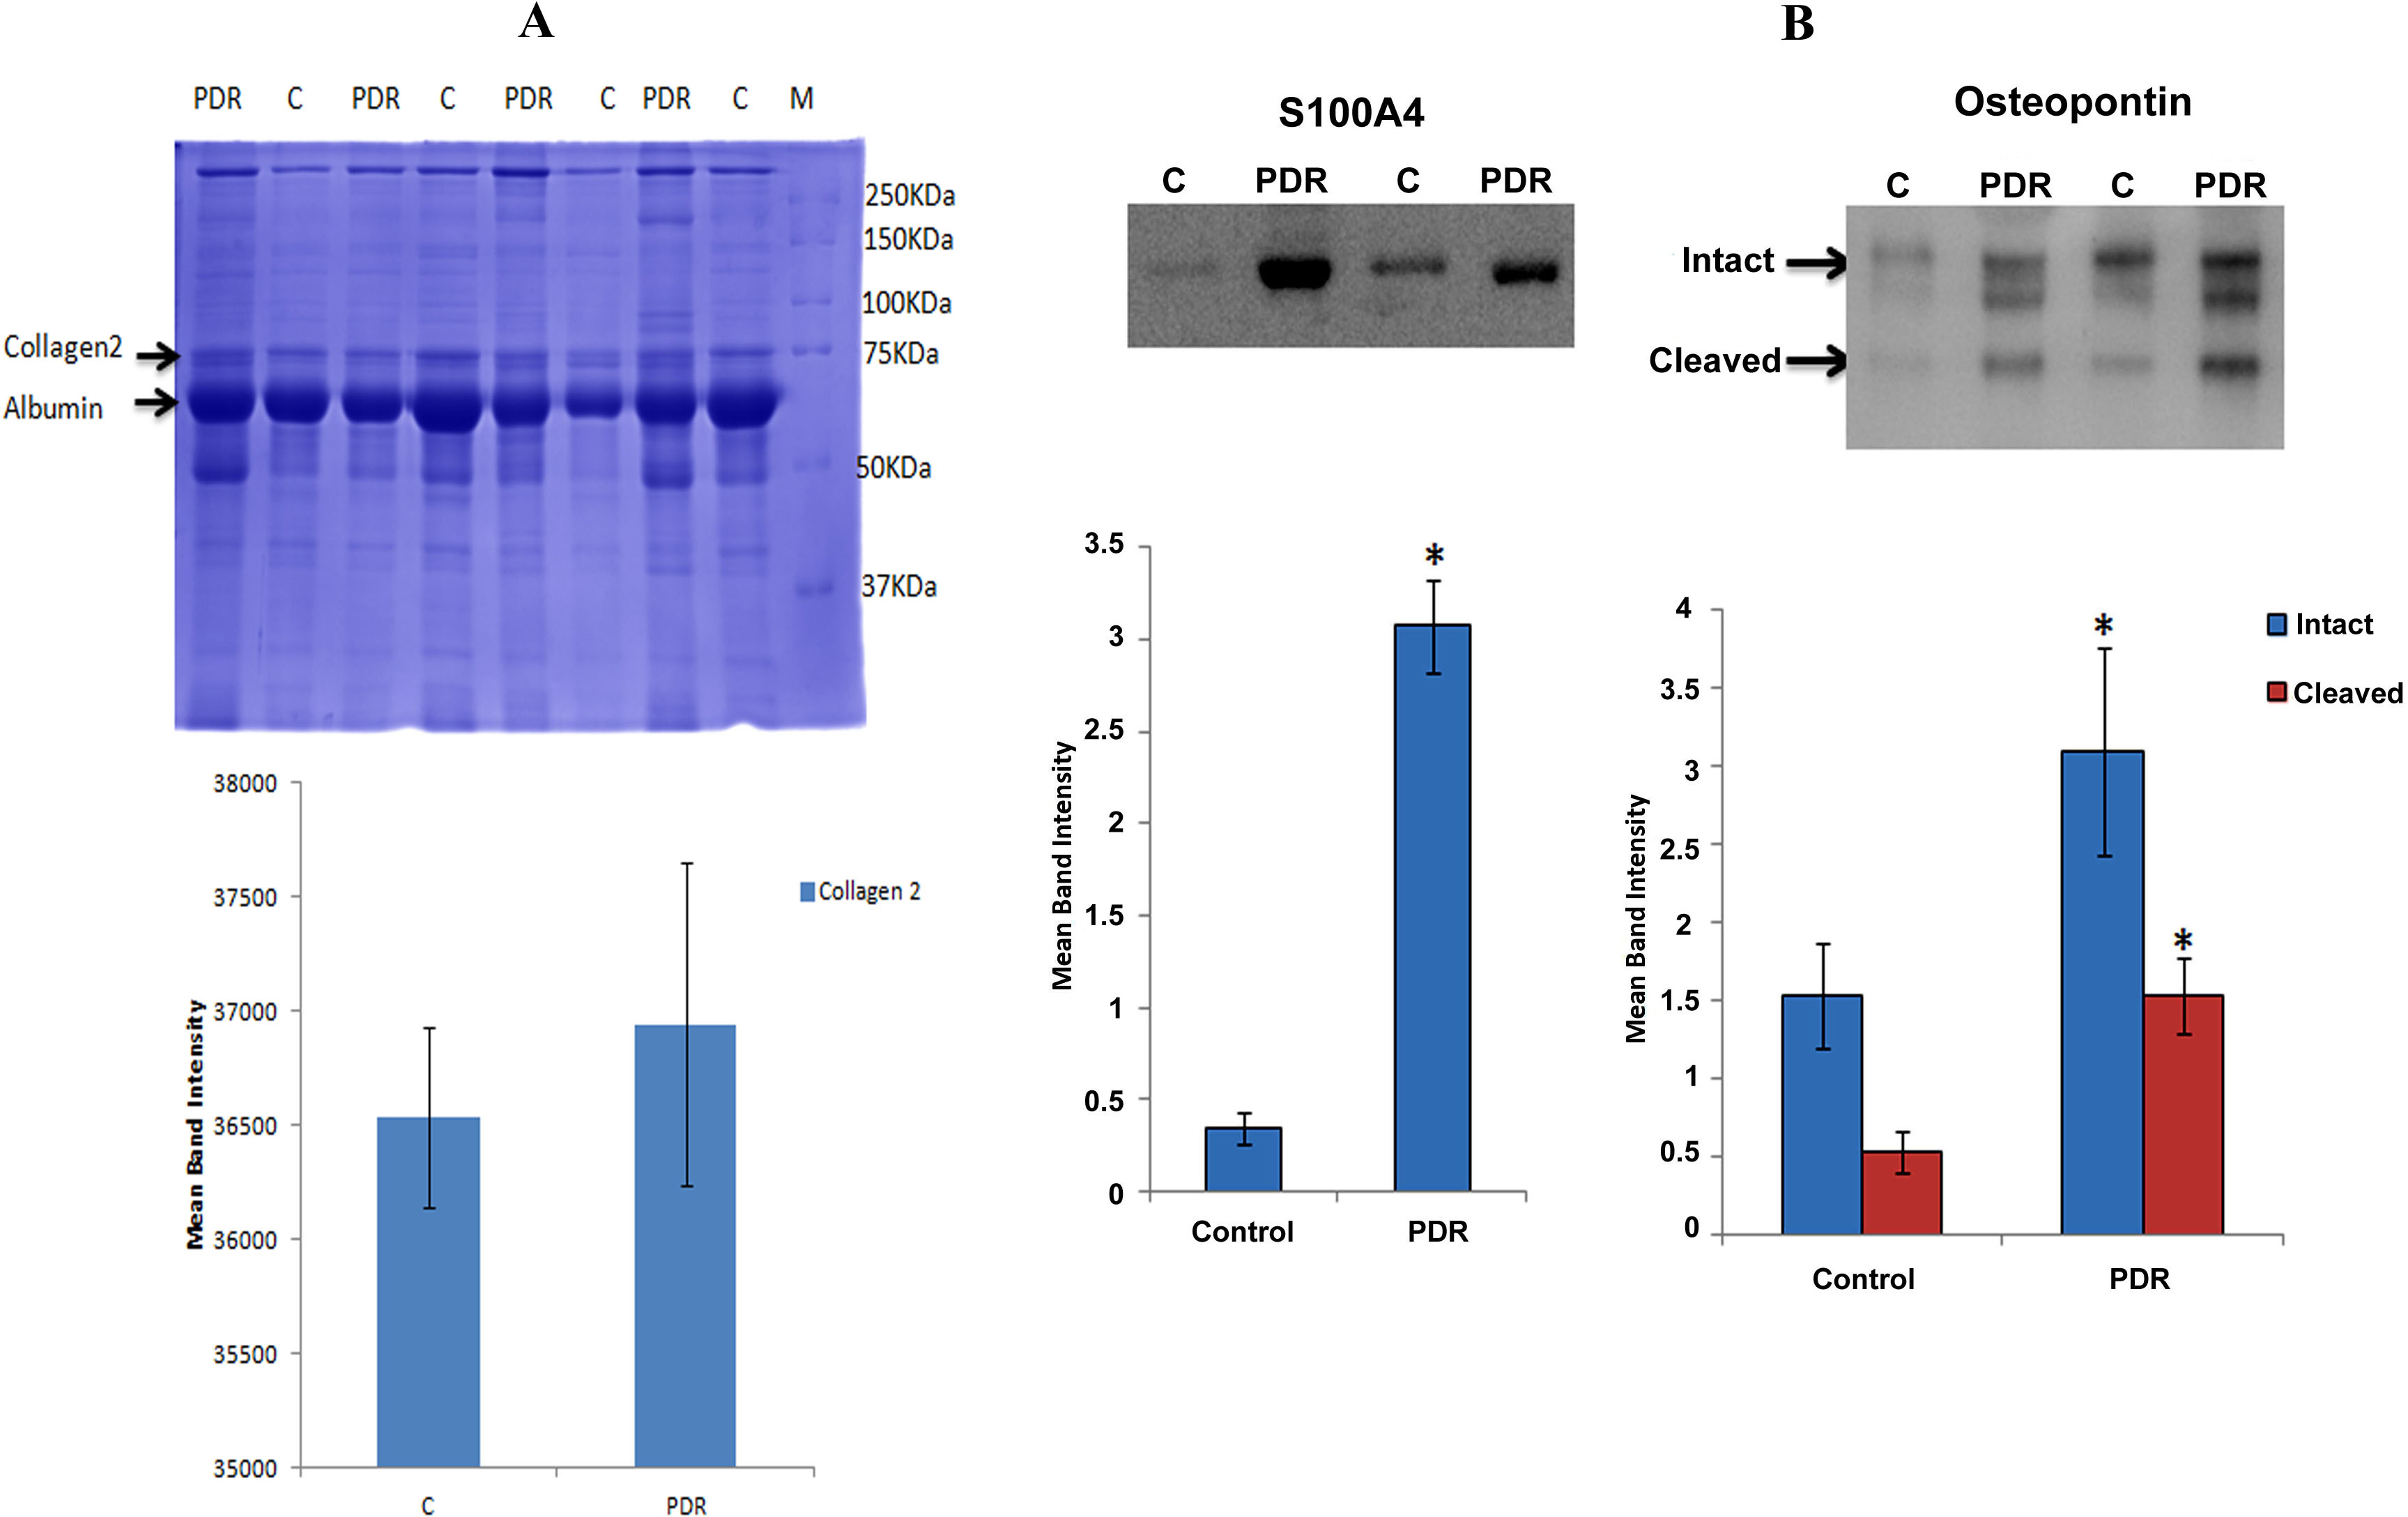
 Figure 3 of
Abu El-Asrar, Mol Vis 2014; 20:1209-1224.
Figure 3 of
Abu El-Asrar, Mol Vis 2014; 20:1209-1224.