Figure 1 of
Abu-Amero, Mol Vis 2014; 20:1203-1208.
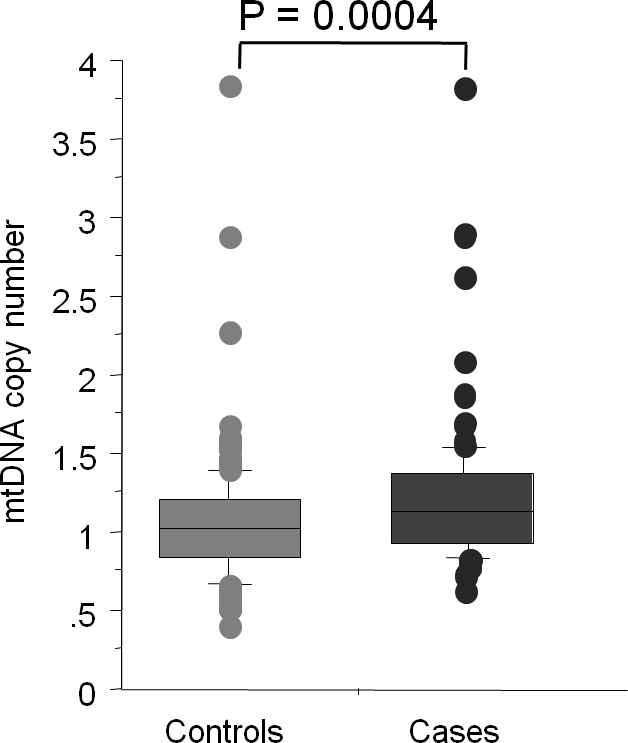
Figure 1.
Box plot showing distribution of the mtDNA copy number in the cases and control groups.
 Figure 1 of
Abu-Amero, Mol Vis 2014; 20:1203-1208. Figure 1 of
Abu-Amero, Mol Vis 2014; 20:1203-1208.
Figure 1 of
Abu-Amero, Mol Vis 2014; 20:1203-1208. Figure 1 of
Abu-Amero, Mol Vis 2014; 20:1203-1208.