Figure 2 of
Sewell, Mol Vis 2014; 20:1182-1191.
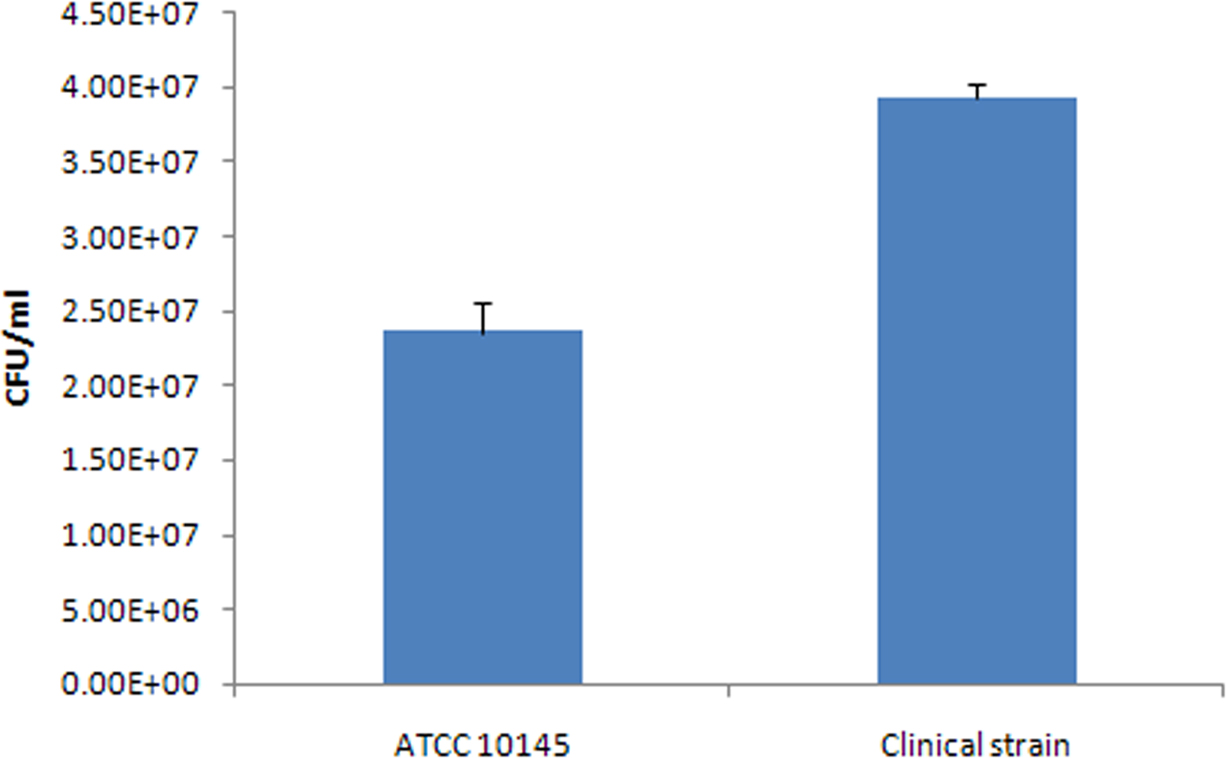
Figure 2.
A bar graph showing the adhesion of ATCC 10145 and the clinical strain to contact lenses. Error bars indicate the standard deviation. The bars represent the average of three replicates per group.
 Figure 2 of
Sewell, Mol Vis 2014; 20:1182-1191.
Figure 2 of
Sewell, Mol Vis 2014; 20:1182-1191.