Figure 1. Bar graphs showing pyoverdine, hemolysin, and swimming motility (A), biofilm formation after 24 h incubation at 37 °C (B), and pyocyanin and pyorubin production (C) by ATCC 10145 and the clinical strain. Error bars indicate the standard deviation. The bars represent the average of three
to five replicates per group.
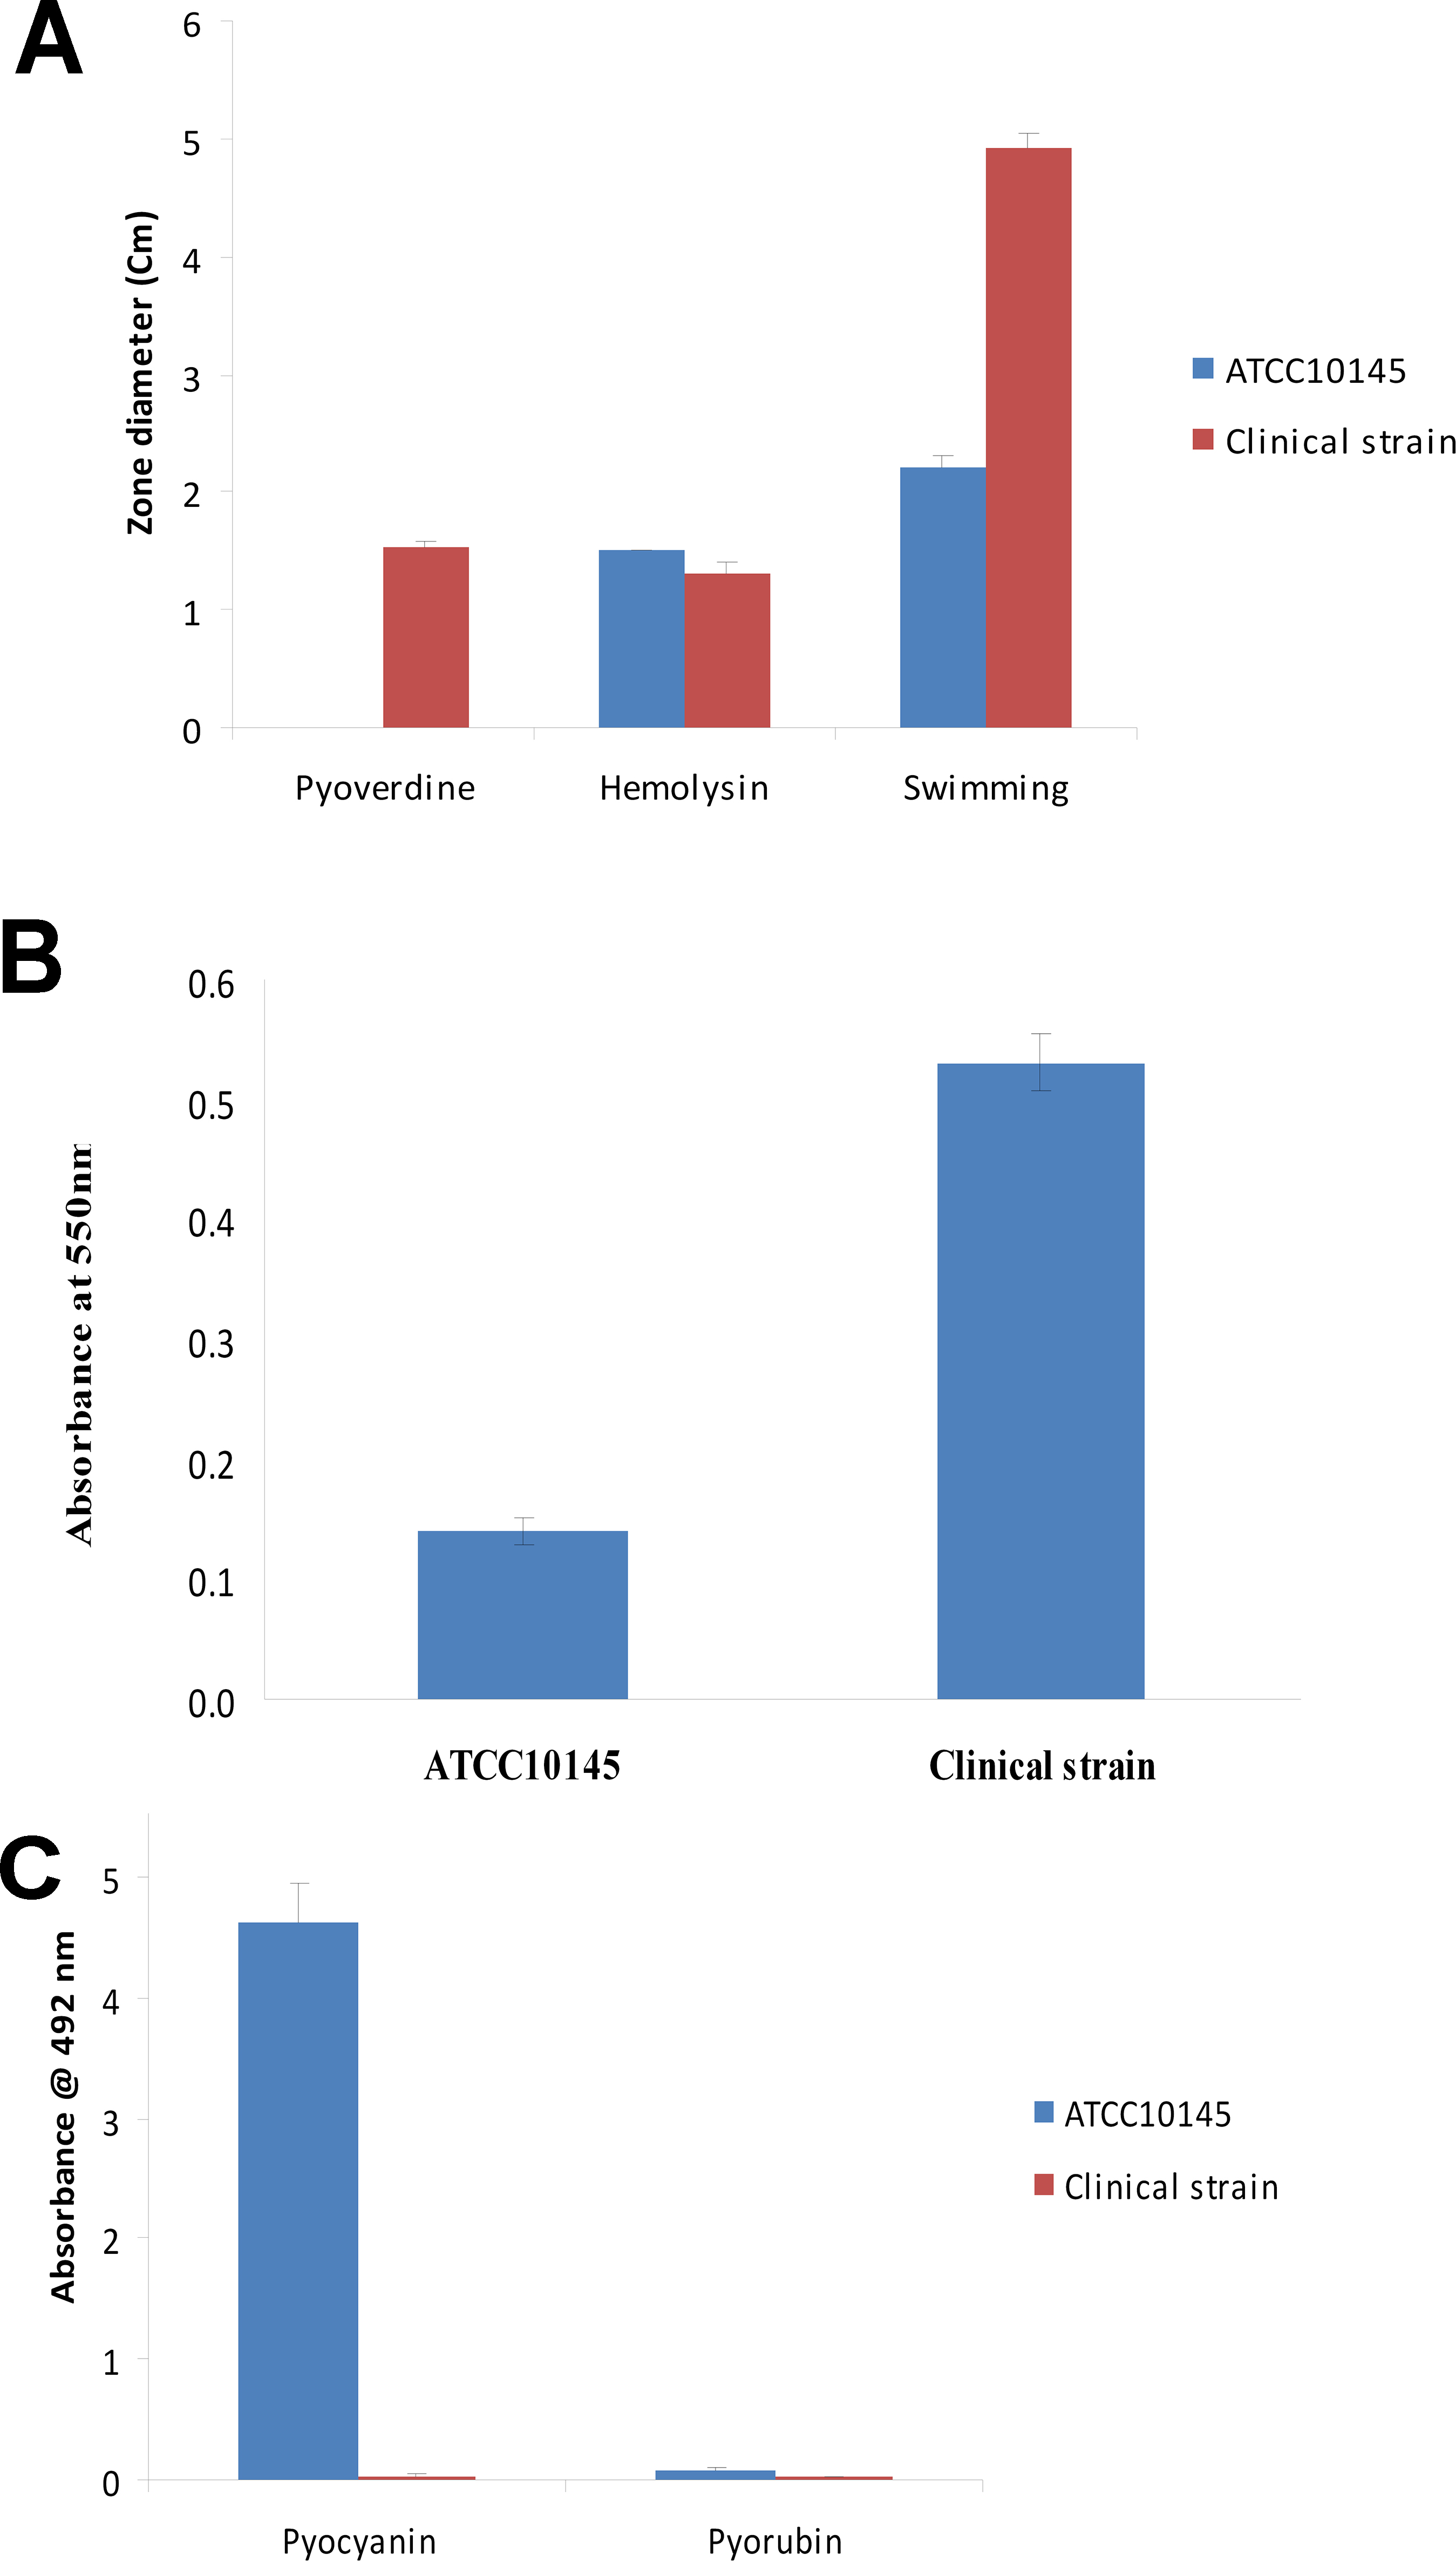
 Figure 1 of
Sewell, Mol Vis 2014; 20:1182-1191.
Figure 1 of
Sewell, Mol Vis 2014; 20:1182-1191.