Figure 3. Functional annotation clustering determined using DAVID Bioinformatics Resources with respect to the target proteins. The
representative groups with an enrichment score of 1.0 or above are presented. The x-axis represents the number of proteins,
while the y-axis represents the ontology categories.
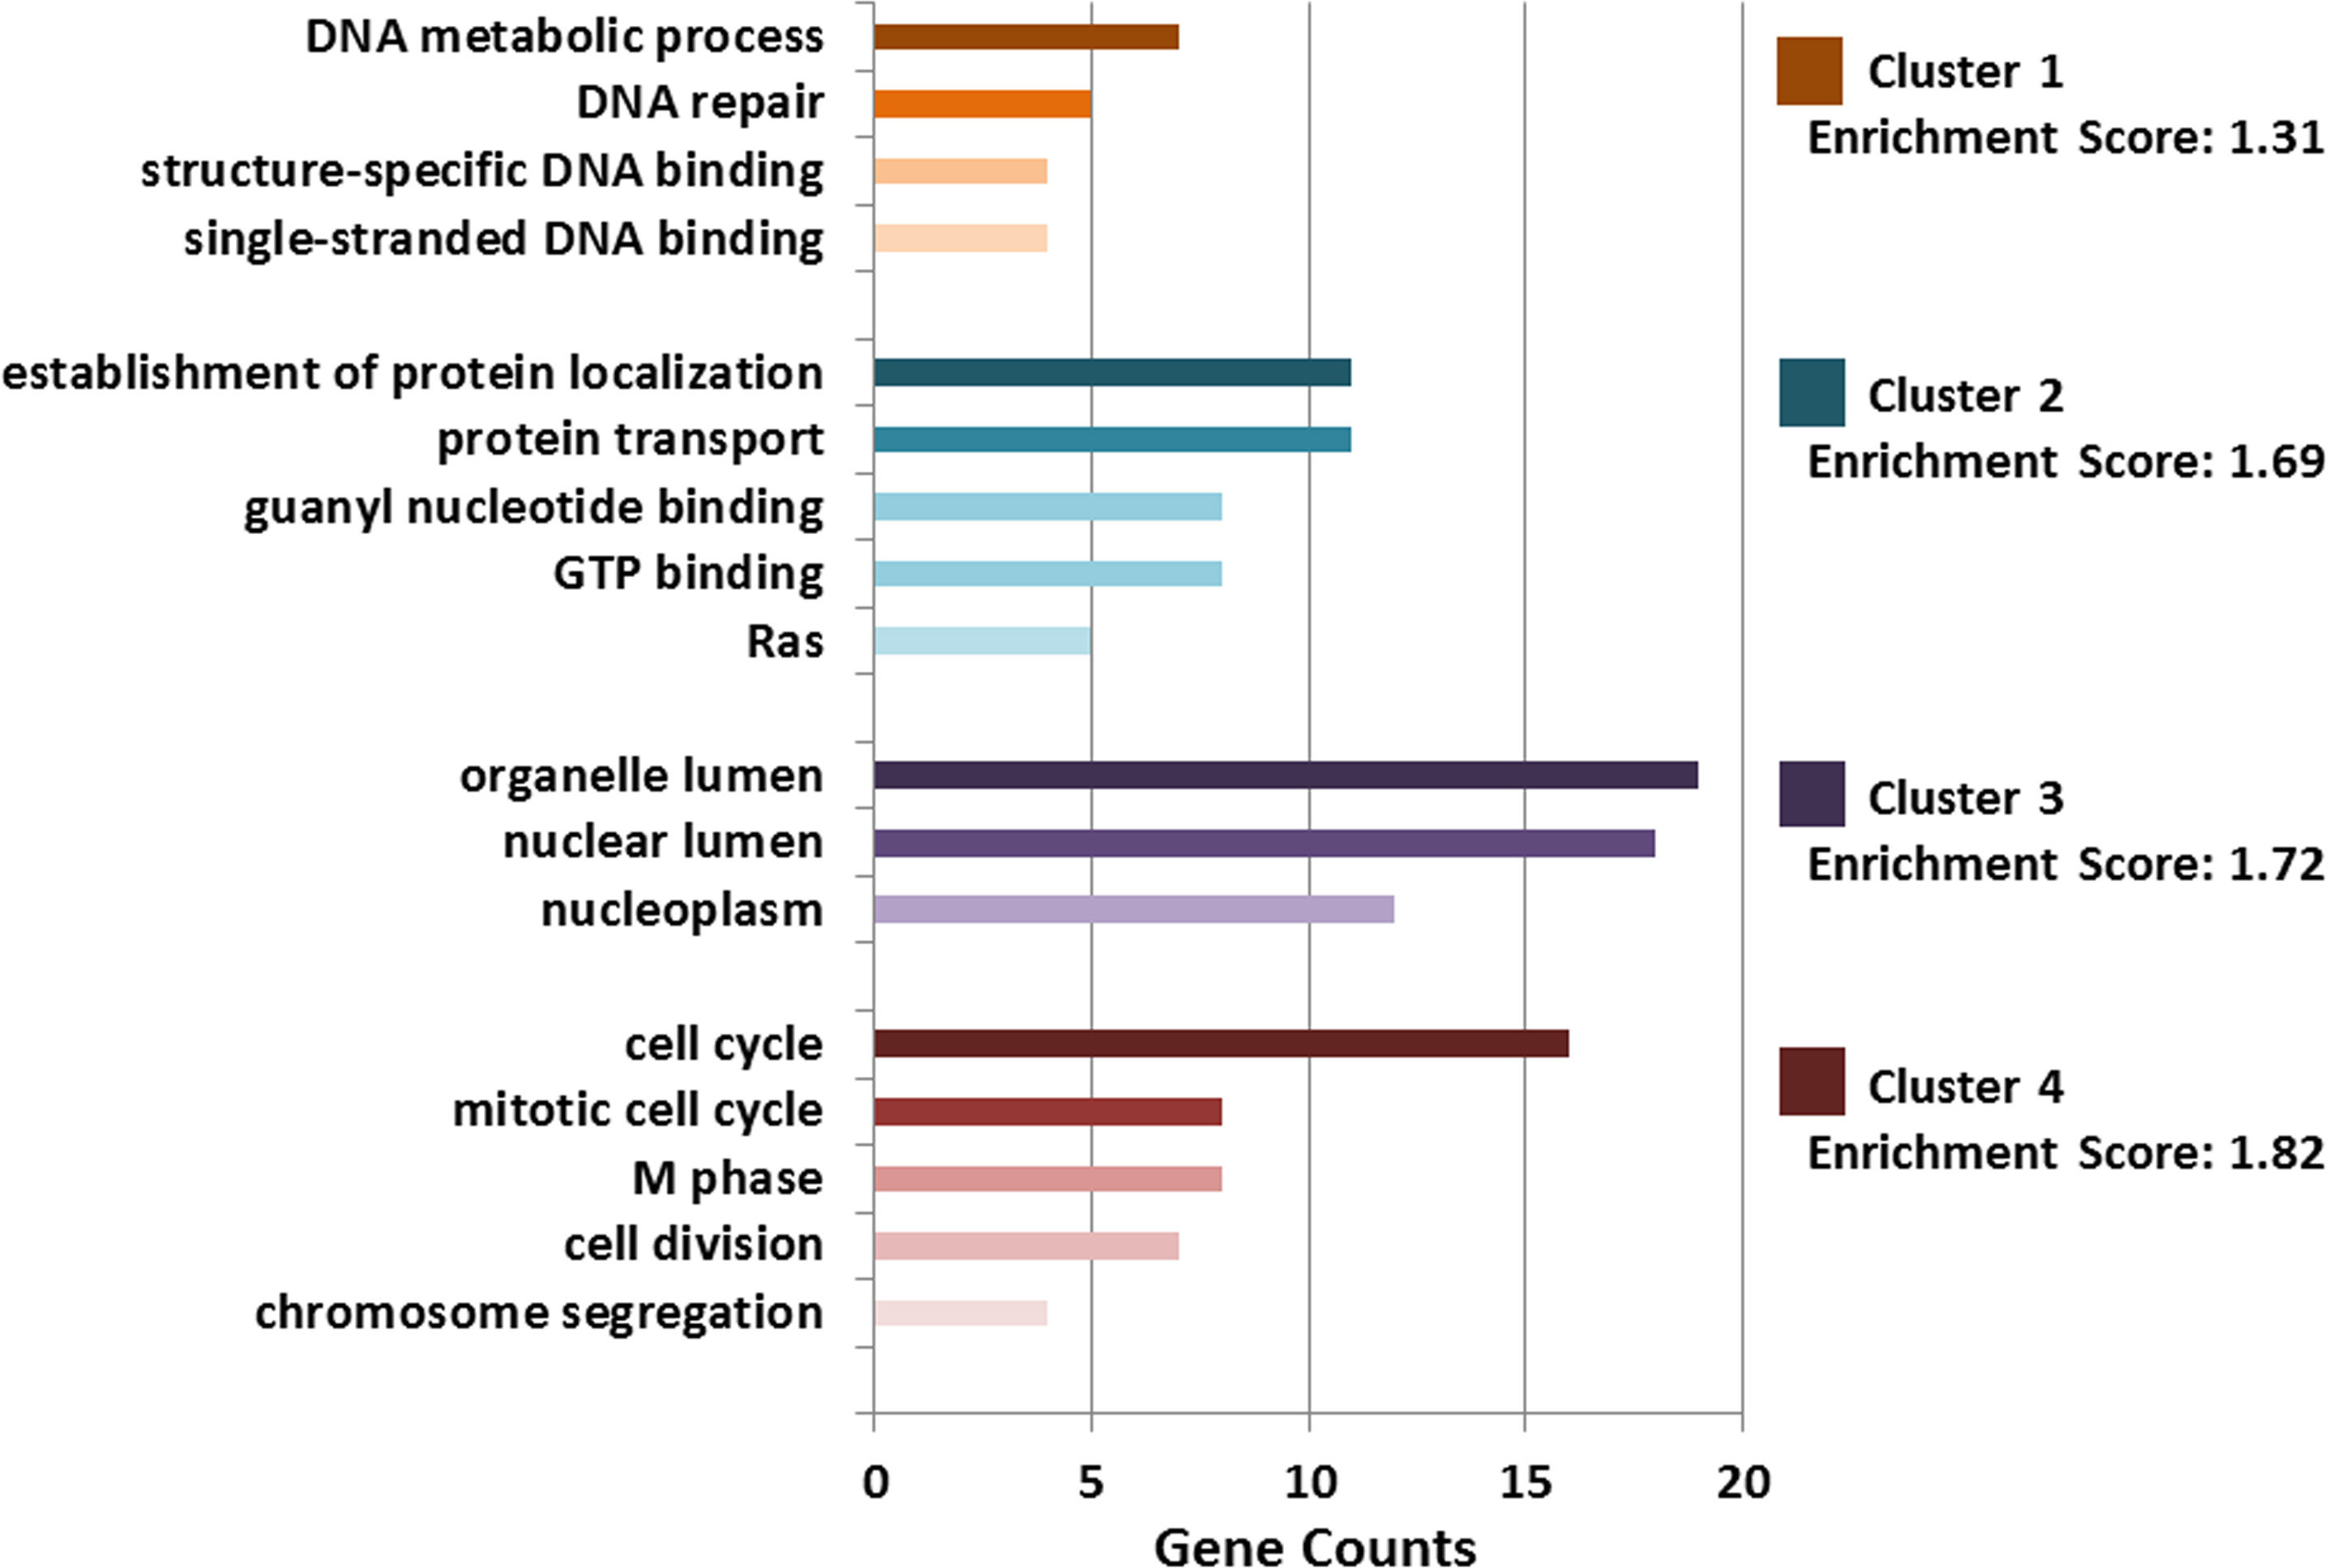
 Figure 3 of
Fan, Mol Vis 2014; 20:117-124.
Figure 3 of
Fan, Mol Vis 2014; 20:117-124.