Figure 3 of
Hang, Mol Vis 2014; 20:1137-1145.
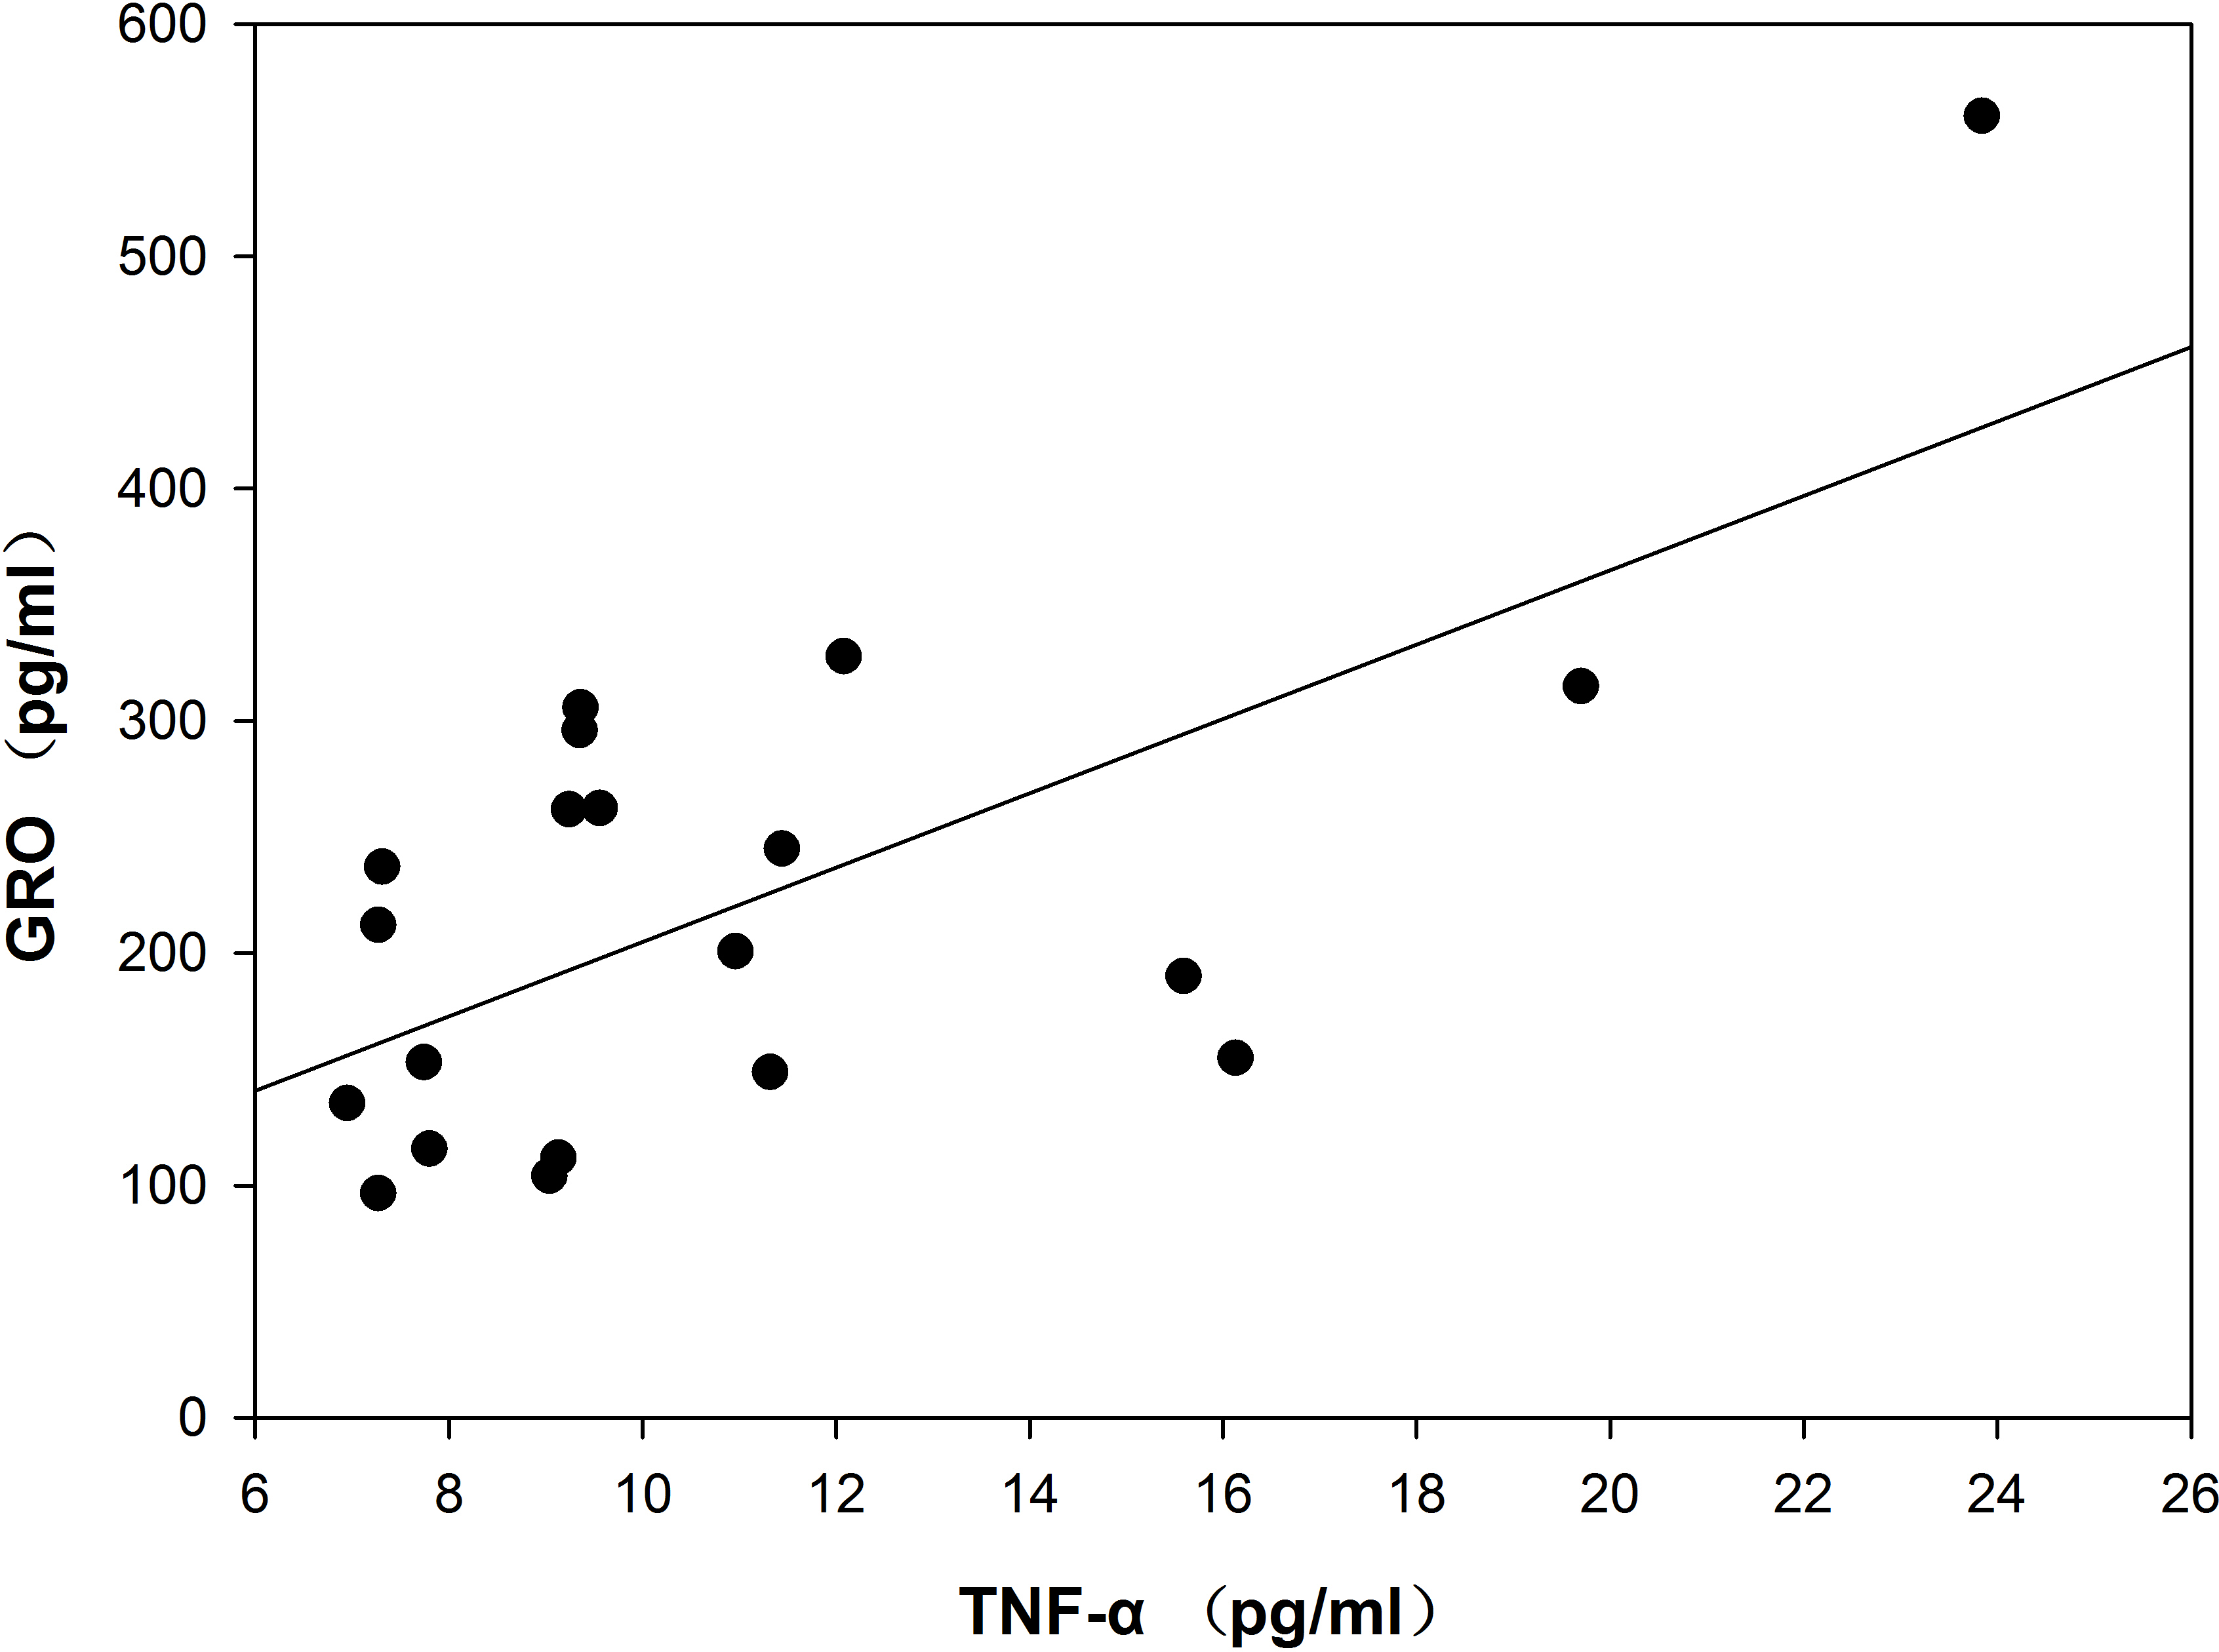
Figure 3.
Scatterplot of tumor necrosis factor-α and growth-related oncogene levels in the proliferative diabetic retinopathy group. The best fit line represents linear regression.
 Figure 3 of
Hang, Mol Vis 2014; 20:1137-1145.
Figure 3 of
Hang, Mol Vis 2014; 20:1137-1145.