Figure 2. Scatterplot of concentration of tumor necrosis factor-α and the three related cytokines (interleukin-8, macrophage inflammatory
protein-1β, and growth-related oncogene) in the diabetic group. The vertical axis is on a logarithmic scale. The best fit
line is created from logarithmic regression.
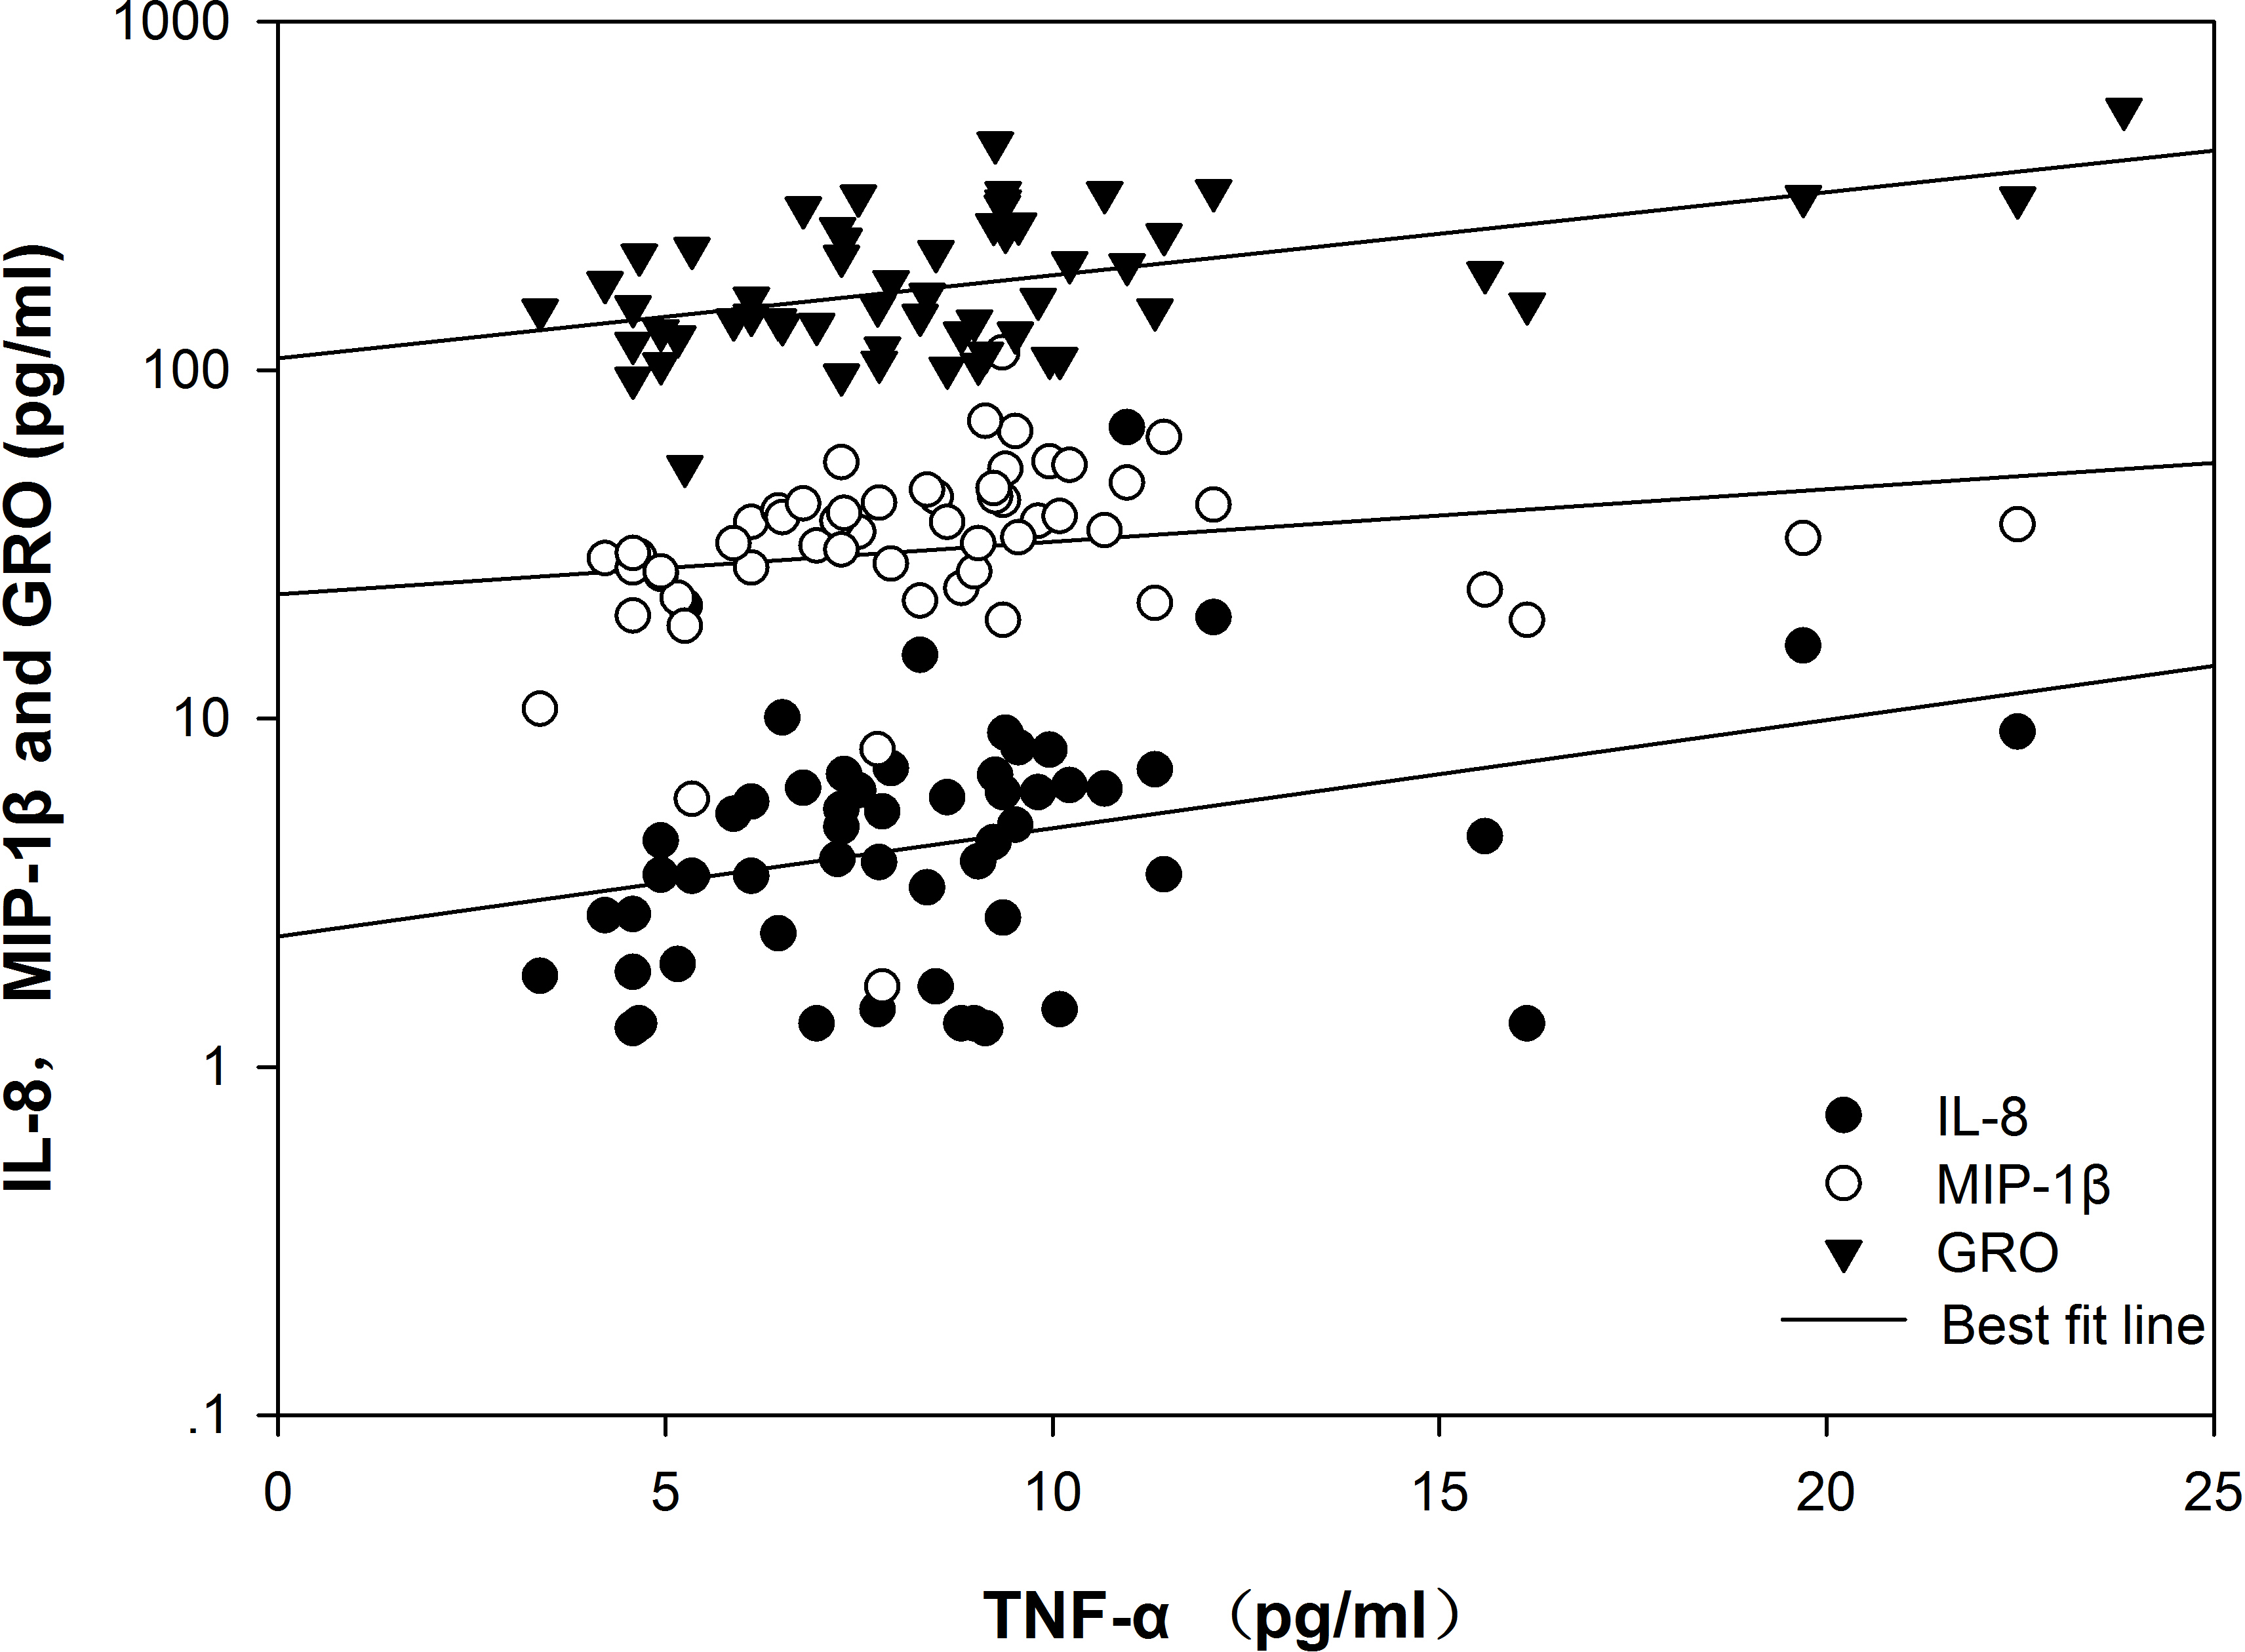
 Figure 2 of
Hang, Mol Vis 2014; 20:1137-1145.
Figure 2 of
Hang, Mol Vis 2014; 20:1137-1145.