Figure 1. Bar graph of tumor necrosis factor-α plasma levels in the control, no apparent diabetic retinopathy, non-proliferative diabetic
retinopathy, and proliferative diabetic retinopathy groups. The tumor necrosis factor (TNF)-α level was significantly higher
in the proliferative diabetic retinopathy (PDR) group compared with the non-proliferative diabetic retinopathy (NPDR; p=0.009,*)
and no apparent diabetic retinopathy (NDR; p=0.001,**) groups.
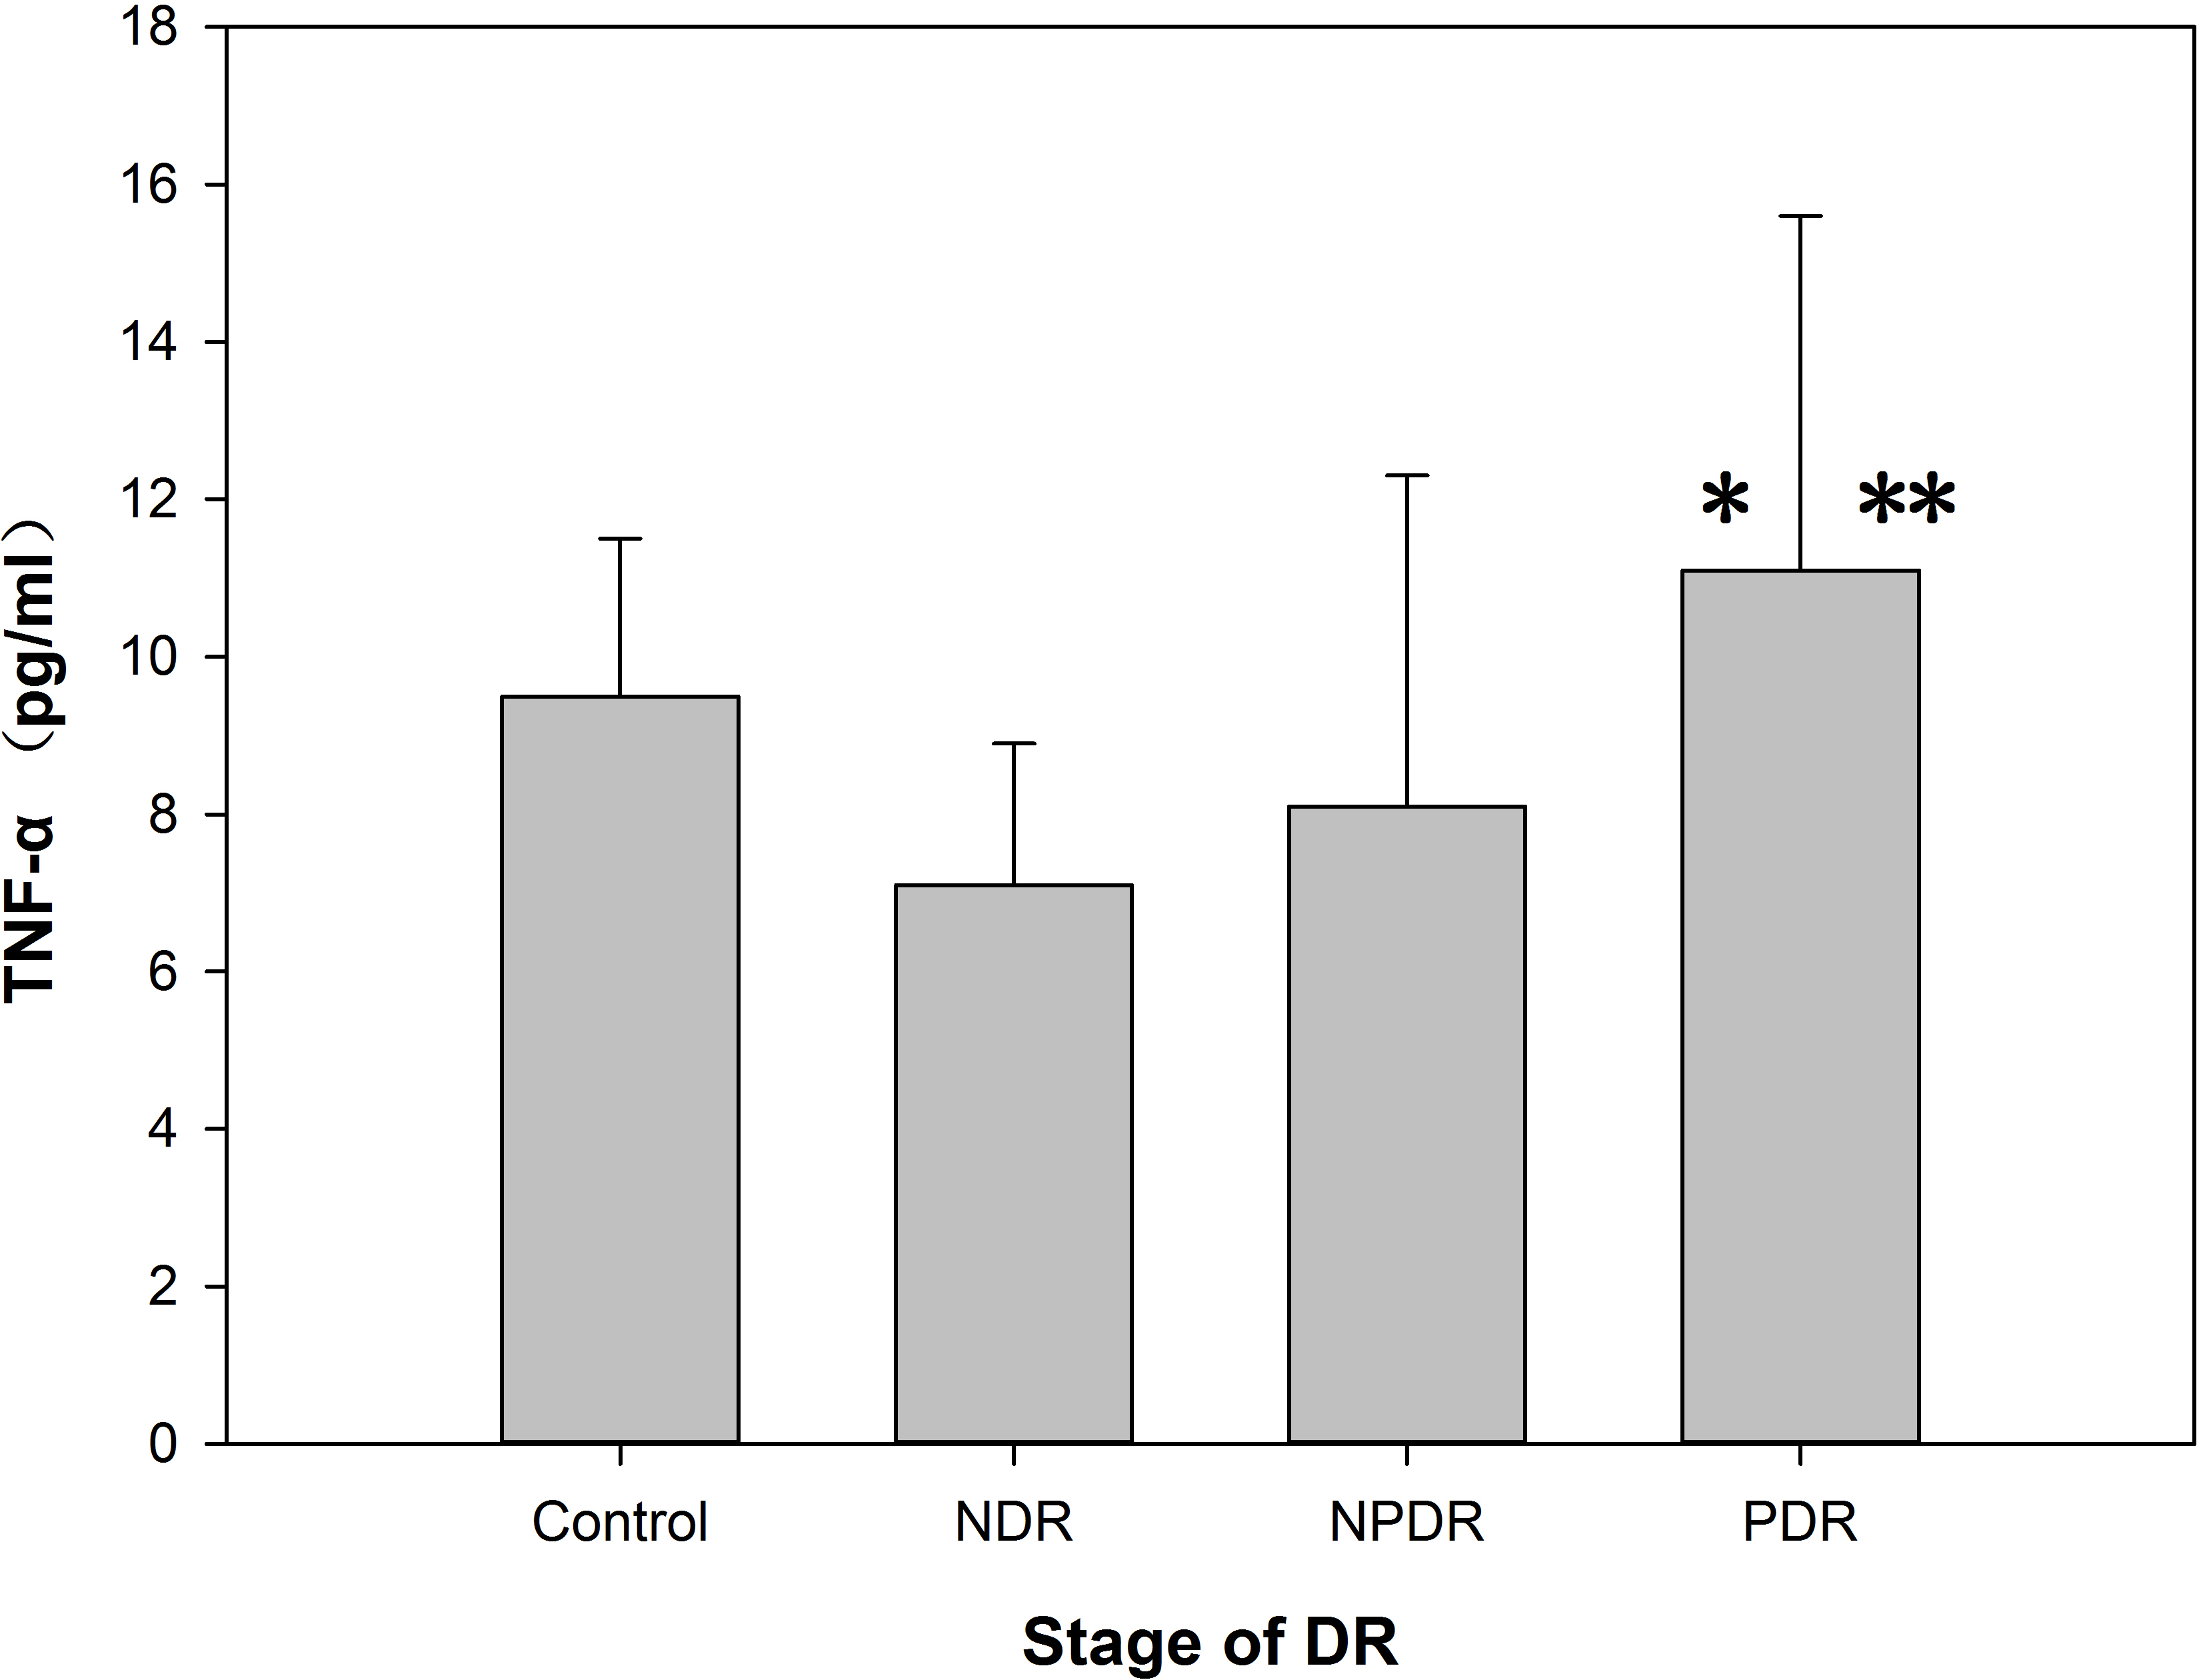
 Figure 1 of
Hang, Mol Vis 2014; 20:1137-1145.
Figure 1 of
Hang, Mol Vis 2014; 20:1137-1145.