Figure 1. RT–PCR analysis of apelin in proliferative diabetic retinopathy (PDR) epiretinal membranes (ERMs) and idiopathic epiretinal
membranes. Lanes 1–12 are samples from the PDR group, and lanes 13–24 are samples from the idiopathic group. Results were
quantified indirectly using BandScan to analyze the grayscale image. Semi-quantitative analysis was performed based on the
gray scale ratio, which revealed that the apelin in the PDR ERMs group was 7.81±0.54 versus 0.42±0.30 in idiopathic ERMs group,
and showed statistically difference between the two groups (t=4.338, P<0.001).
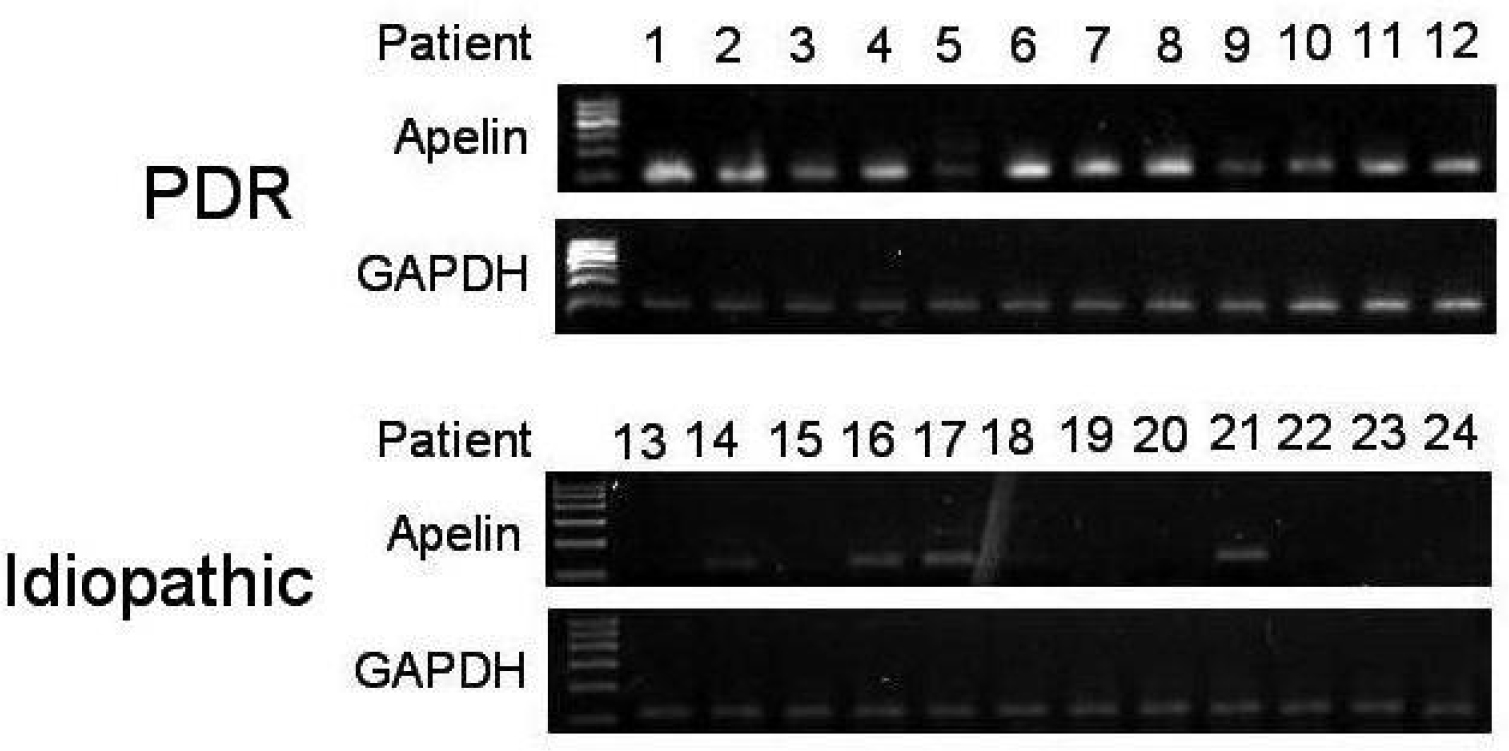
 Figure 1 of
Lu, Mol Vis 2014; 20:1122-1131.
Figure 1 of
Lu, Mol Vis 2014; 20:1122-1131.