Figure 5. Proliferating cell nuclear antigen (PCNA) expression during intense light exposure. Pigmented tg:zop:nfsB:EGFP zebrafish (A) or nonpigmented albino zebrafish (B) were subjected to intense light damage, and retinas were collected at the indicated time points and processed for immunohistochemistry.
Retina sections were stained with anti-green fluorescent protein (GFP; green in panel A) and anti-PCNA (panels A and B) antibodies; nuclei were counterstained with TOPRO (blue). Dorsal retinas are shown. Arrowheads indicate PCNA+ rod precursors in the ONL. C: Quantification of PCNA+ cells in the INL and ONL. Data represent mean±standard deviation; n = 3–7 retinas per time point. ONL, outer nuclear layer;
INL, inner nuclear layer; GCL, ganglion cell layer. Scale bar is 50 µm.
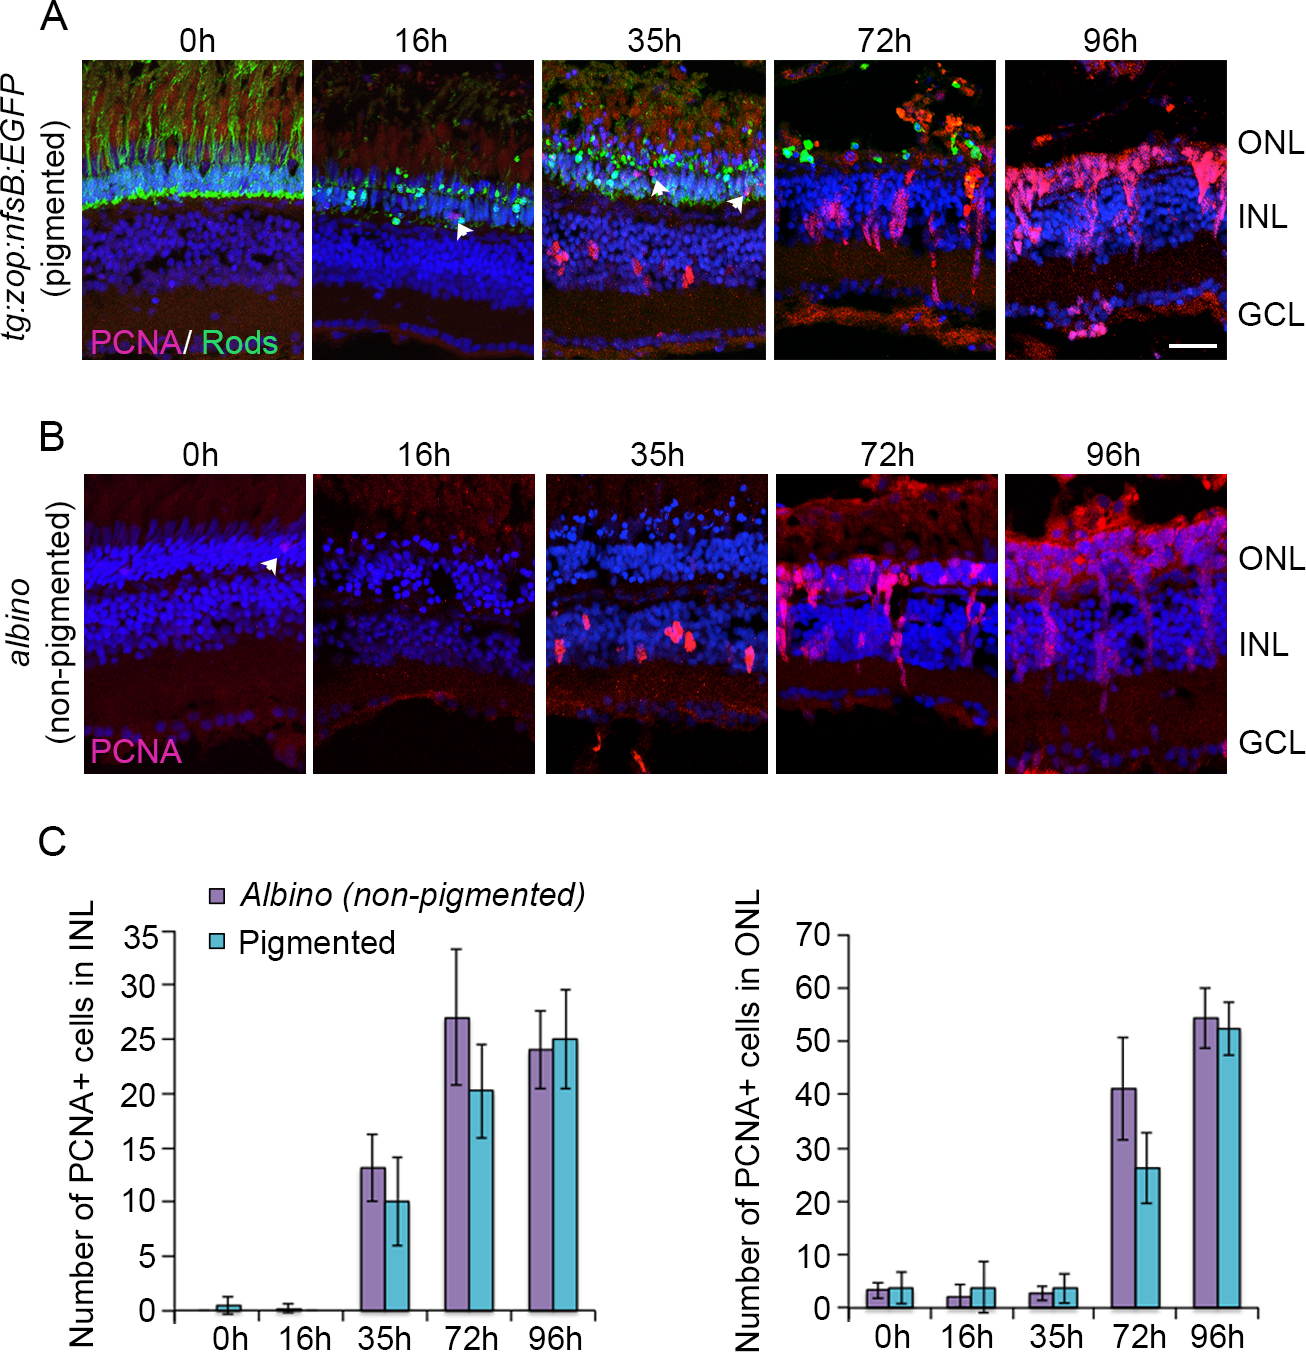
 Figure 5 of
Rajaram, Mol Vis 2014; 20:1075-1084.
Figure 5 of
Rajaram, Mol Vis 2014; 20:1075-1084.