Figure 1. Linkage disequilibrium between the single nucleotide polymorphisms identified by resequencing in the CFH gene in Mexicans. The LD for SNPs is displayed in white for r2=0; shades of gray for 0<r2<1; and black for r2=1. The r2 values between any two SNPs is listed in the cross cells. At the top, a schematic representation of CFH shows exons and introns where are located each SNP.
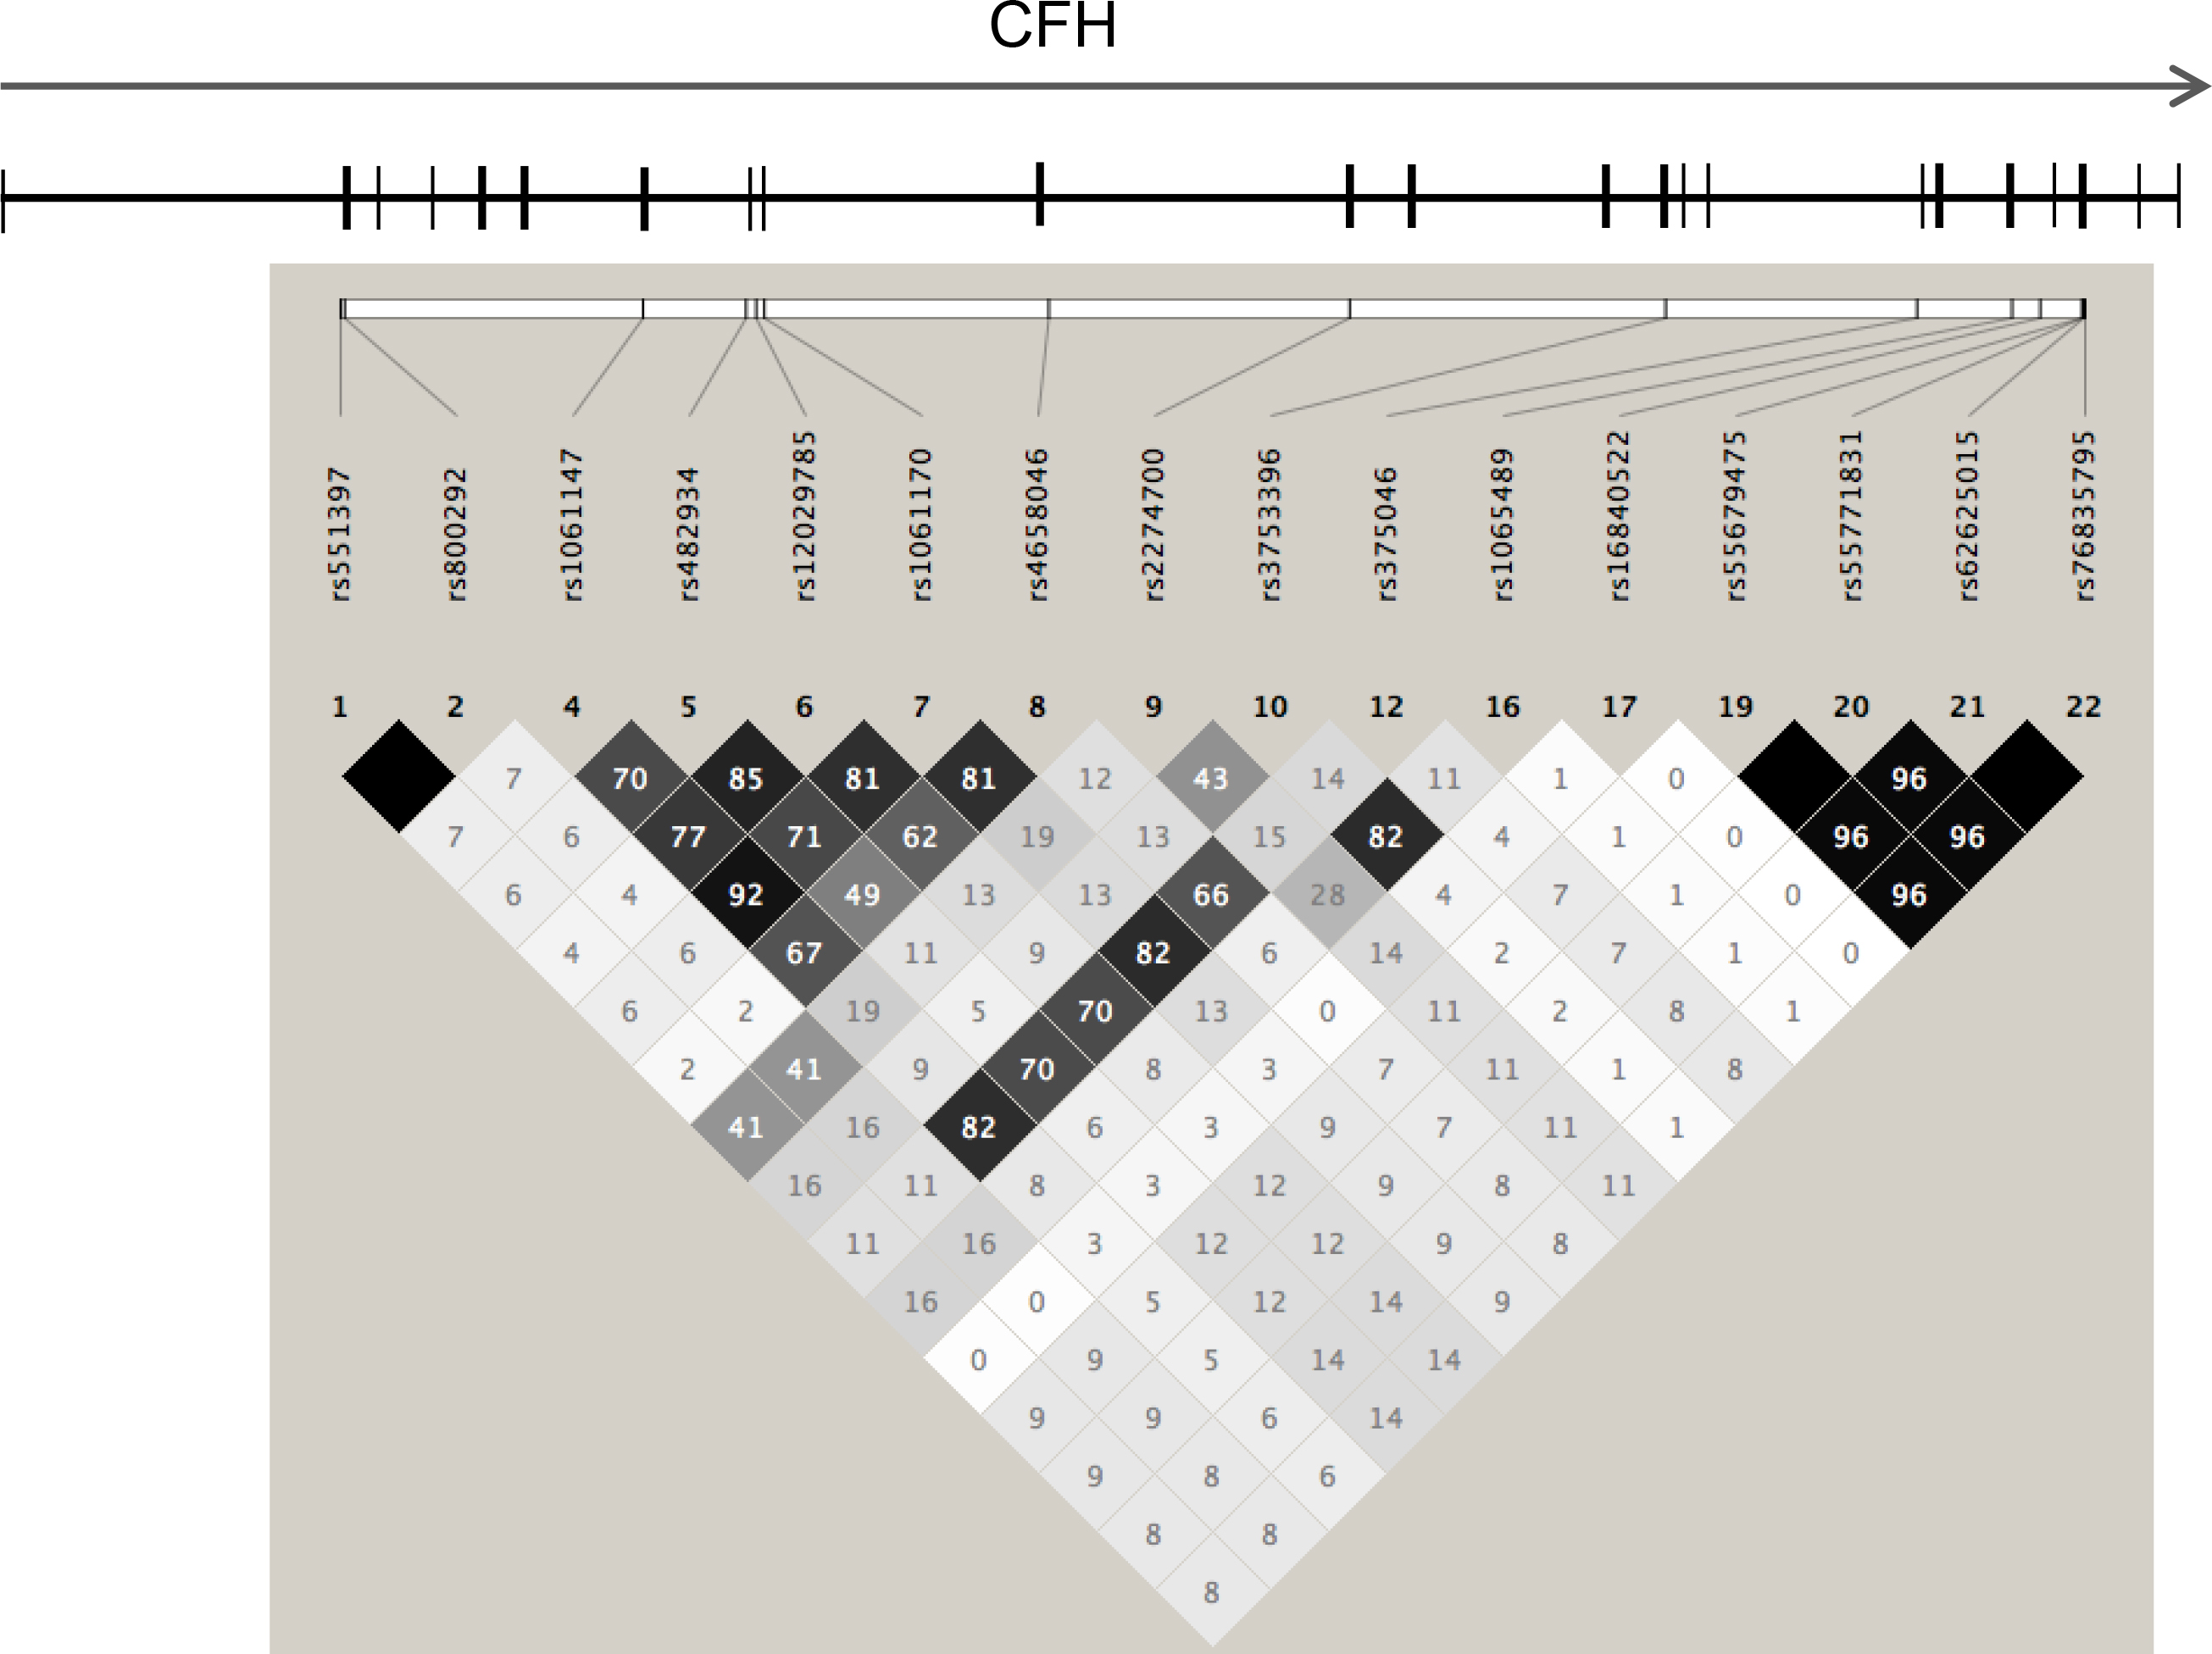
 Figure 1 of
Contreras, Mol Vis 2014; 20:105-116.
Figure 1 of
Contreras, Mol Vis 2014; 20:105-116.