Figure 2. Hierarchical clustering analysis based on the DNA methylation data obtained from six Chlamydophila psittaci–positive and six Chlamydophila psittaci–negative ocular adnexal extranodal marginal zone B-cell lymphoma cases (Chlamydophila psittaci [Cp]-positive: P1–P6, Cp-negative: N1–N6). The 184 significant methylated CpG sites were selected with the criteria |delta mean| >0.06 and p<0.05.
The color scale of the heat map represents densely methylated loci (red) to sparsely methylated loci (green). All cases were
clearly clustered into two groups.
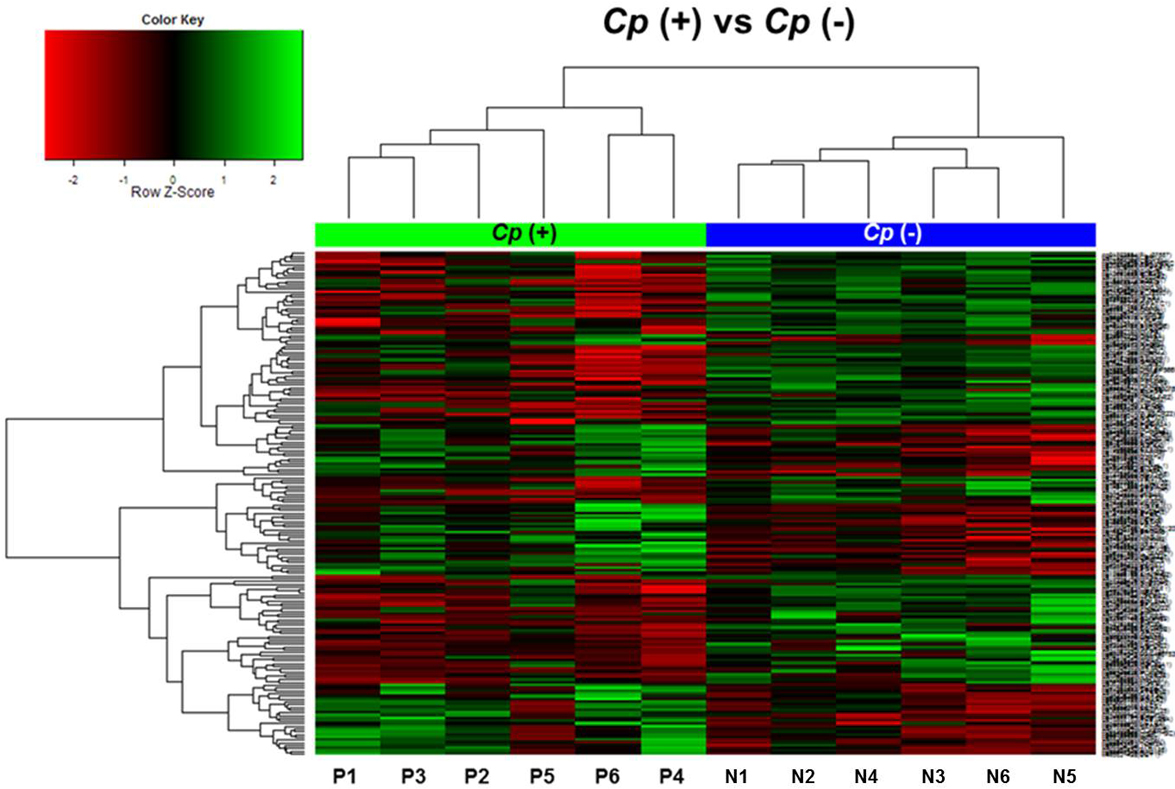
 Figure 2 of
Lee, Mol Vis 2014; 20:1037-1047.
Figure 2 of
Lee, Mol Vis 2014; 20:1037-1047.