Figure 7. Begg’s Funnel plot for the meta-analysis of the genetic model of ε3/ε4 vs. ε3/ε3. The horizontal line in the figure means
the overall estimated log-transformed odds ratio (OR) and the two diagonal lines represent the pseudo 95% confidence limits
of the effect estimate(95% CI).
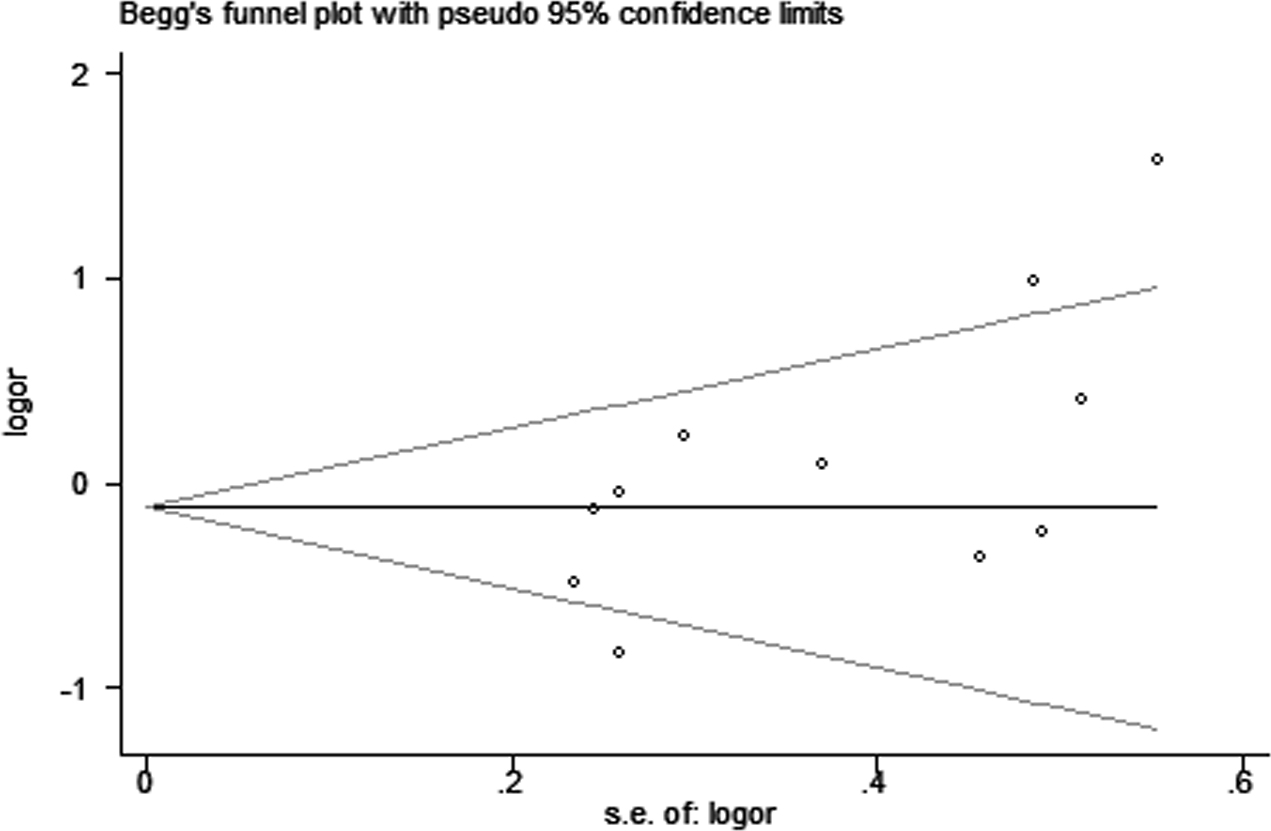
 Figure 7 of
Liao, Mol Vis 2014; 20:1025-1036.
Figure 7 of
Liao, Mol Vis 2014; 20:1025-1036.