Figure 5. Subgroup analysis stratified by ethnicity in the genetic model of ε4/ε4 vs. ε3/ε3. Every study was represented by a square
whose size was proportional to the weight of the study. Diamond indicated summary odds ratios (OR) with its corresponding
the pseudo 95% confidence limits (95% CI).
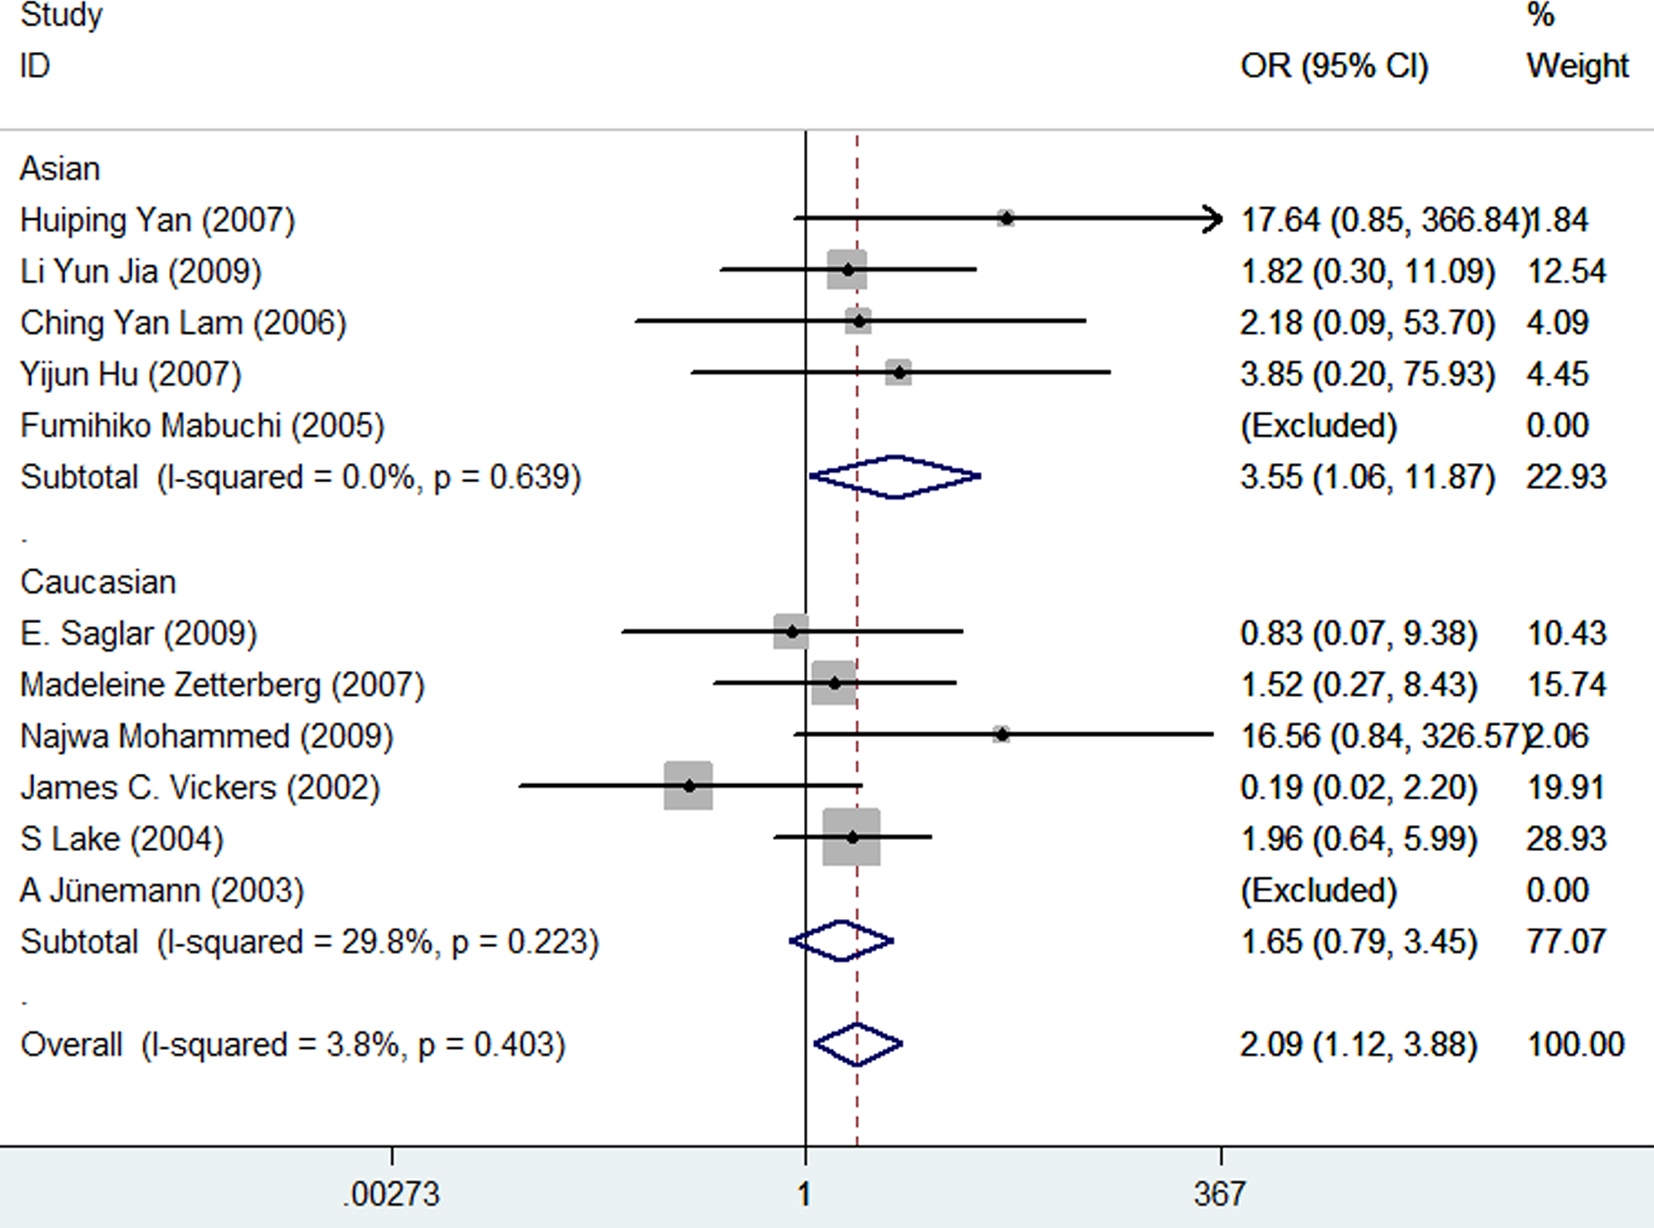
 Figure 5 of
Liao, Mol Vis 2014; 20:1025-1036.
Figure 5 of
Liao, Mol Vis 2014; 20:1025-1036.