Figure 4. Forest plots for APOE polymorphisms and primary open-angle glaucoma risk in the genetic models of ε2 allele vs. ε3 allele
and ε4 allele vs. ε3 allele. Every study was represented by a square whose size was proportional to the weight of the study.
Diamond indicated summary odds ratios (OR) with its corresponding the pseudo 95% confidence limits (95% CI). A: Forest plot for APOE polymorphisms and POAG risk in the genetic model of ε2 allele vs. ε3 allele. B: Forest plot for APOE polymorphisms and POAG risk in the genetic model of ε4 allele vs. ε3 allele.
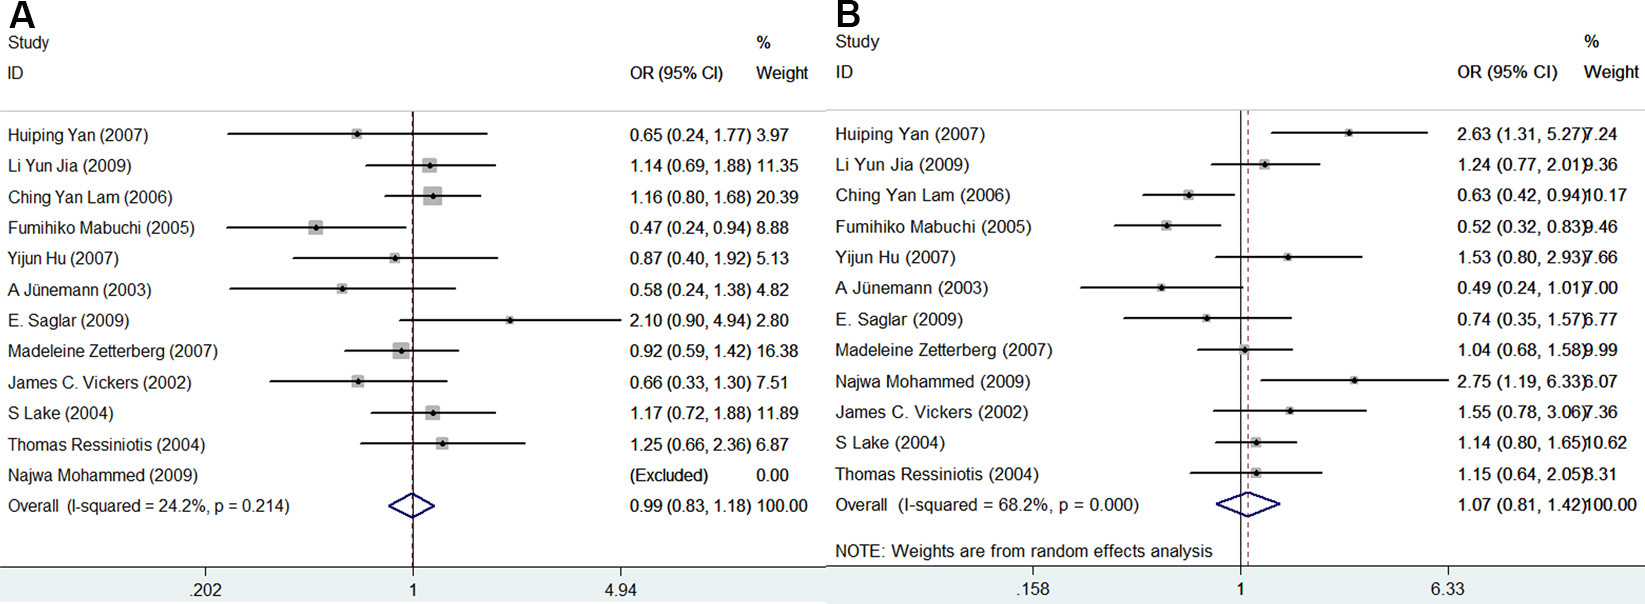
 Figure 4 of
Liao, Mol Vis 2014; 20:1025-1036.
Figure 4 of
Liao, Mol Vis 2014; 20:1025-1036.