Figure 4. Densitometric analysis of the cross-linked product formed by gamma irradiation (GI) αA-crystallin wild-type and N-terminal
mutants. The bar diagram represents the densitometric analysis of the cross-linked product at different dosages of 0, 0.5,
1.0, and 2.0 kGy formed by GI: (A) αA-crystallin wild-type (wt), (B) R12C, (C) R21L, (D) R49C, and (E) R54C. Each bar represents the mean±standard deviation (SD) of three experiments. *p<0.05, **p<0.01, *** p<0.001 (compared
to lane 1 in each case).
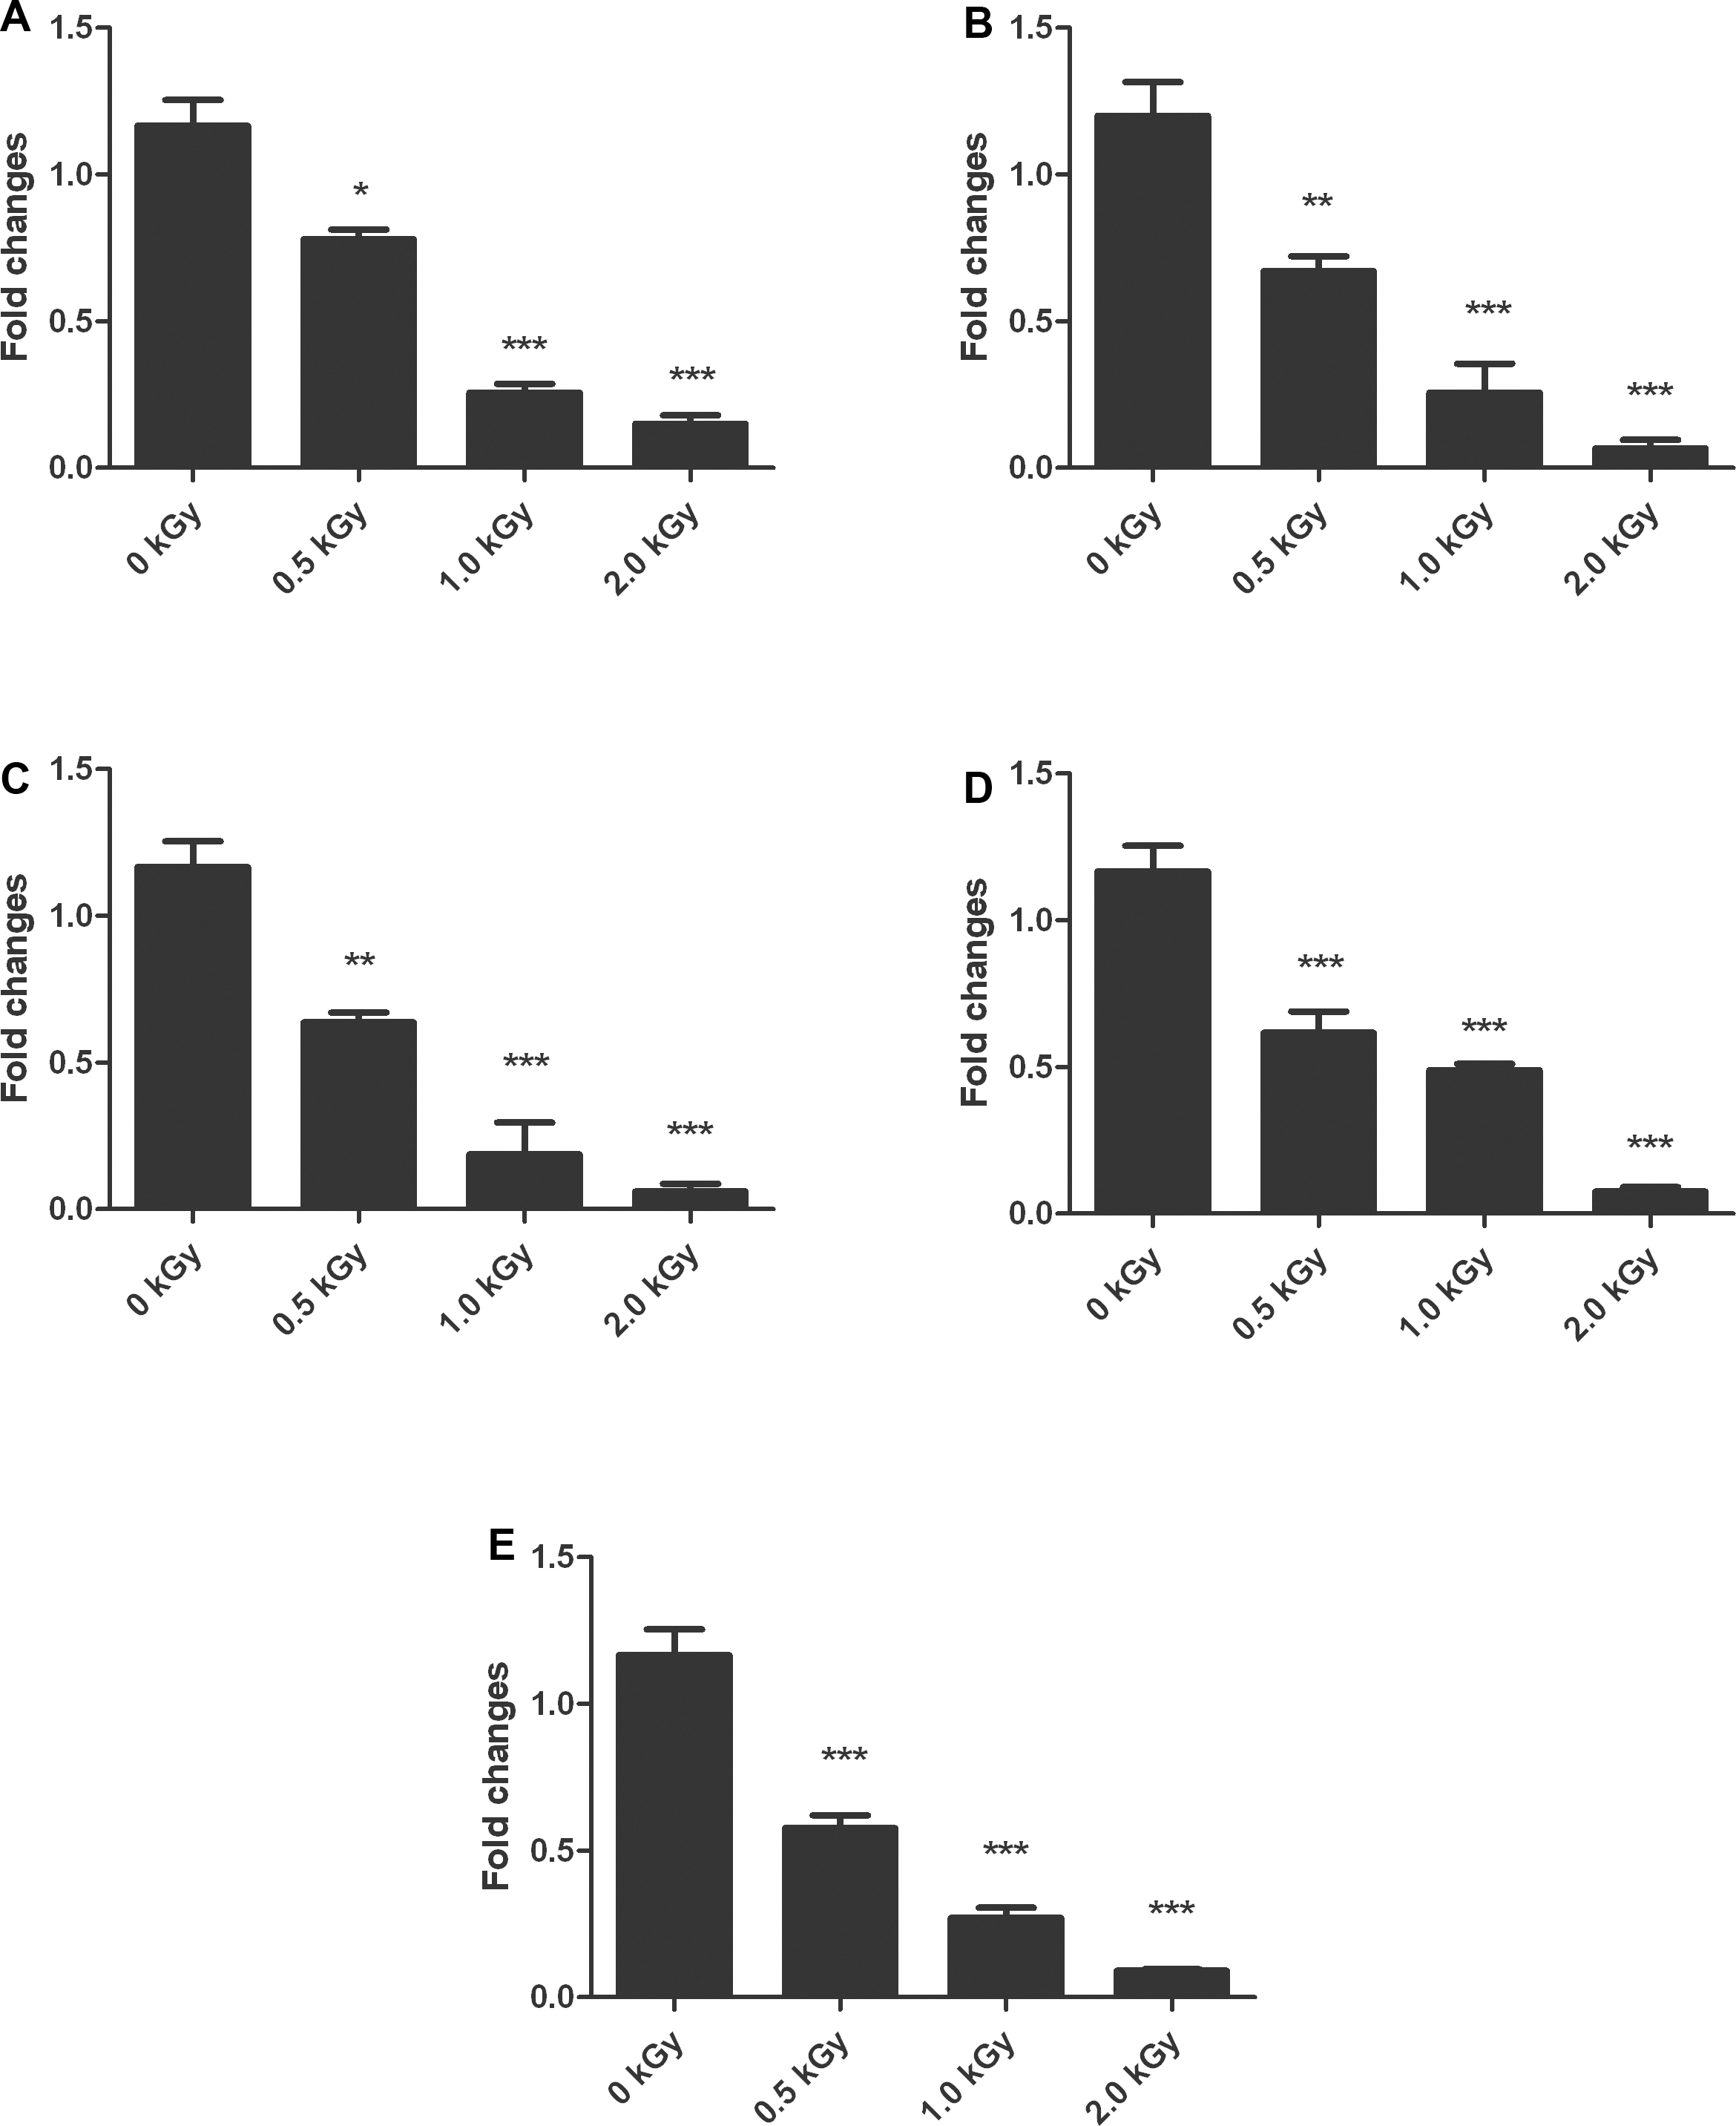
 Figure 4 of
Ramkumar, Mol Vis 2014; 20:1002-1016.
Figure 4 of
Ramkumar, Mol Vis 2014; 20:1002-1016.