![]() Figure 1 Top and Bottom of
Tink et al.
Figure 1 Top and Bottom of
Tink et al.
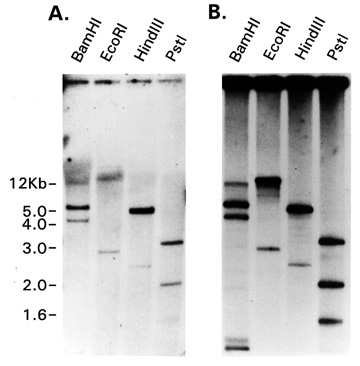
A: Genomic P1 clone (0.3 ug) and B: human genomic DNA (10 ug) were digested with EcoRI (E), BamHI (B), HindIII (H) and PstI (P). The digested samples were separated on a 1% agarose TBE gel, blotted and hybridized with a PEDF cDNA probe. A 1 kb ladder is given to show relative sizes of the hybridizing bands. The figure shows similarities in restriction pattern between the genomic DNA and the P1 clone.
Exons 1-8 are numbered and shown as black boxes. BamHI (B), EcoRI (E) and NotI (N) sites are shown with letters and arrows. The gene is approximately 16 kb in length. A rule bar with the relative size in kilobases (kb) is shown at the bottom. Several overlapping clones from which the sequence were obtained are shown above the P1 clone.