Figure 2. Clinical and genotyping results for family F2. A: Pedigree of family F2. Haplotypes spanning 16q23–24 are shown below each symbol. Each different haplotype block is represented
by a different color with the disease haplotype colored black. B: Ocular coherence tomography (OCT) macular thickness data for family member IV:5 showing bilateral foveal hypoplasia in an
otherwise normal retina. C: Slit-lamp result for IV:5 showing posterior embryotoxon (arrow).
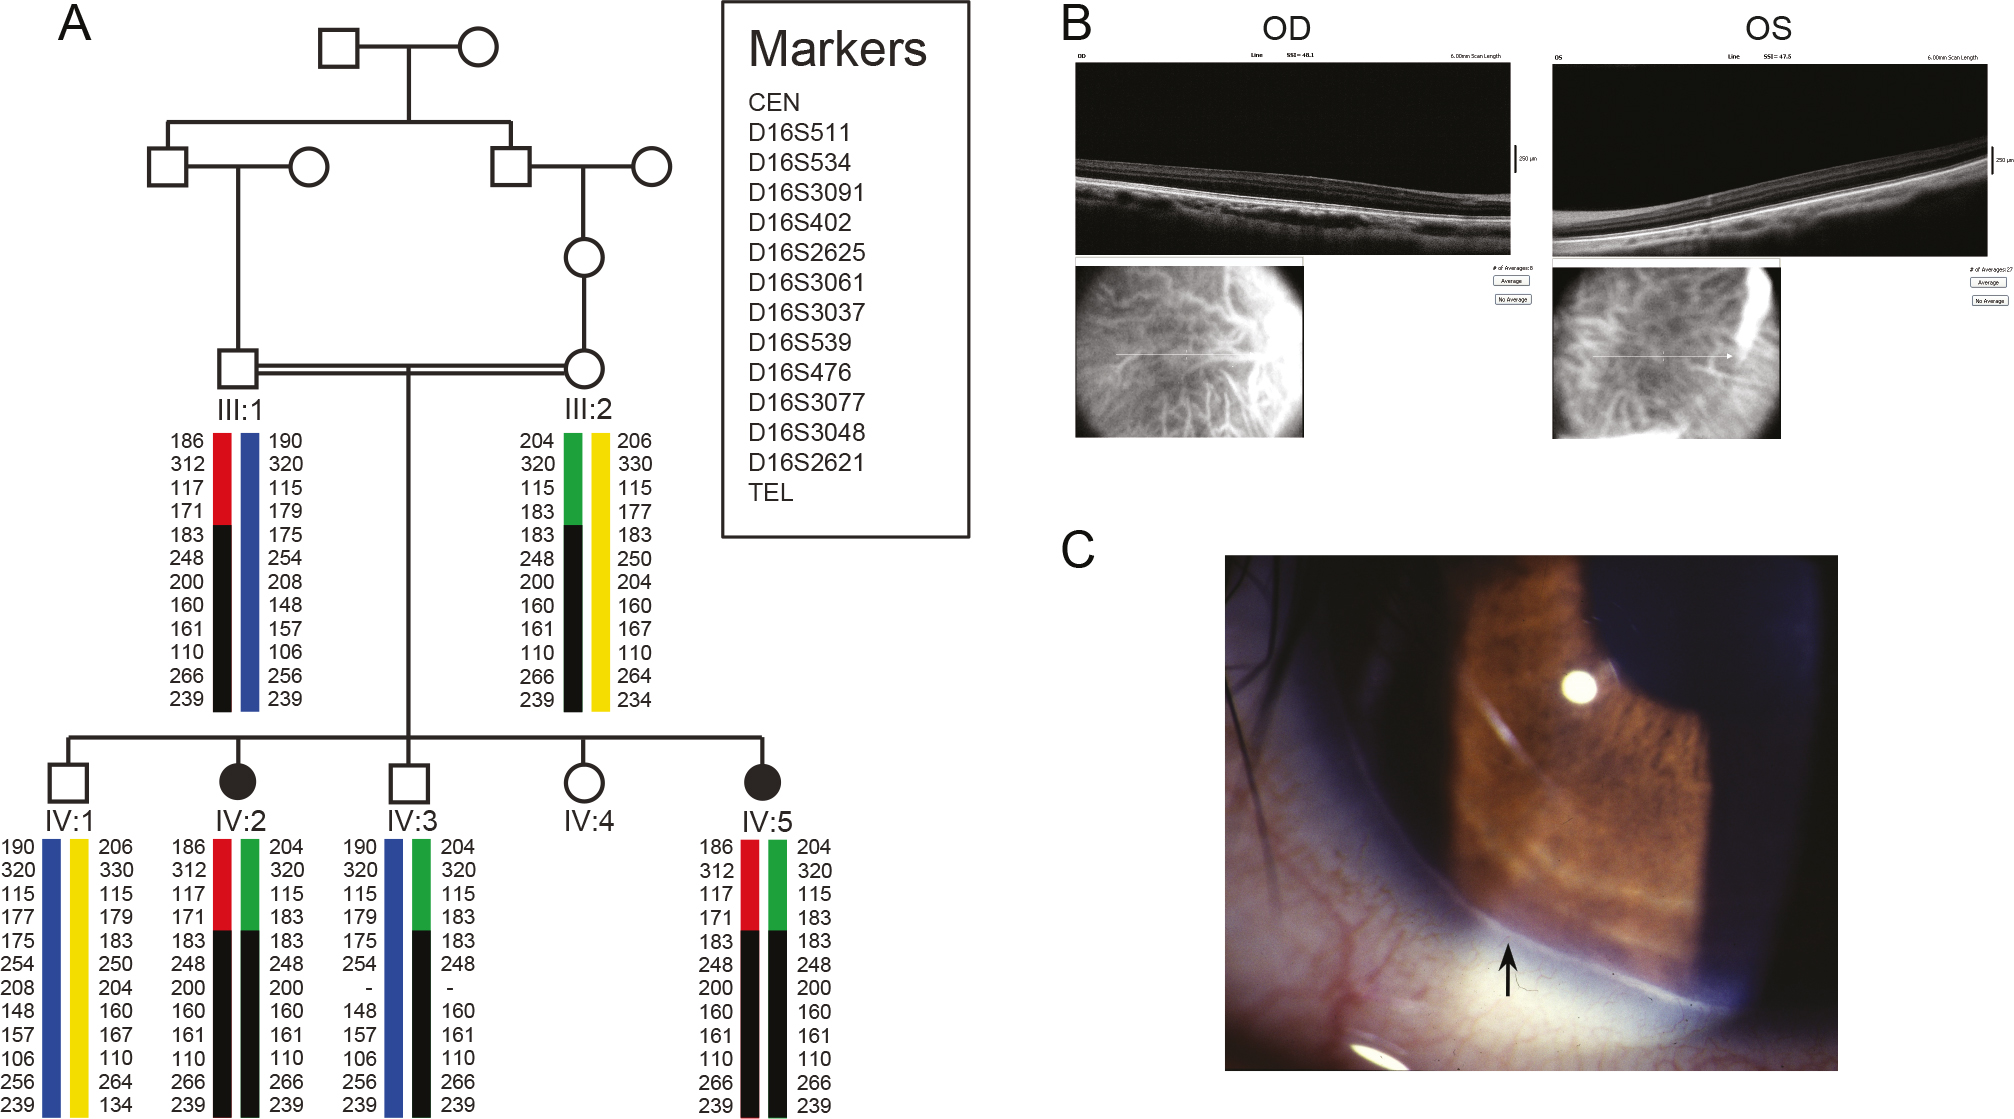
 Figure 2 of
Al-Araimi, Mol Vis 2013; 19:2165-2172.
Figure 2 of
Al-Araimi, Mol Vis 2013; 19:2165-2172.