Figure 1. Clinical results of family F1. A: Pedigree of family F1. Individuals represented by solid symbols have been confirmed as affected by clinical examination.
B: Ocular coherence tomography (OCT) macular thickness data for family member IV:1 showing bilateral foveal hypoplasia in an
otherwise normal retina. C: Fundus image showing foveal hypoplasia in family member IV:1. D: Flash visual evoked potential (VEP) results of IV:1 (upper panel) and IV:3 (lower panel) showing contralateral asymmetry
of VEP. The arrow shows the N2 peak, which is similar to that seen in albinos. OD, right eye; OS, left eye. Note the time
on the x-axis begins at time-point -15 ms.
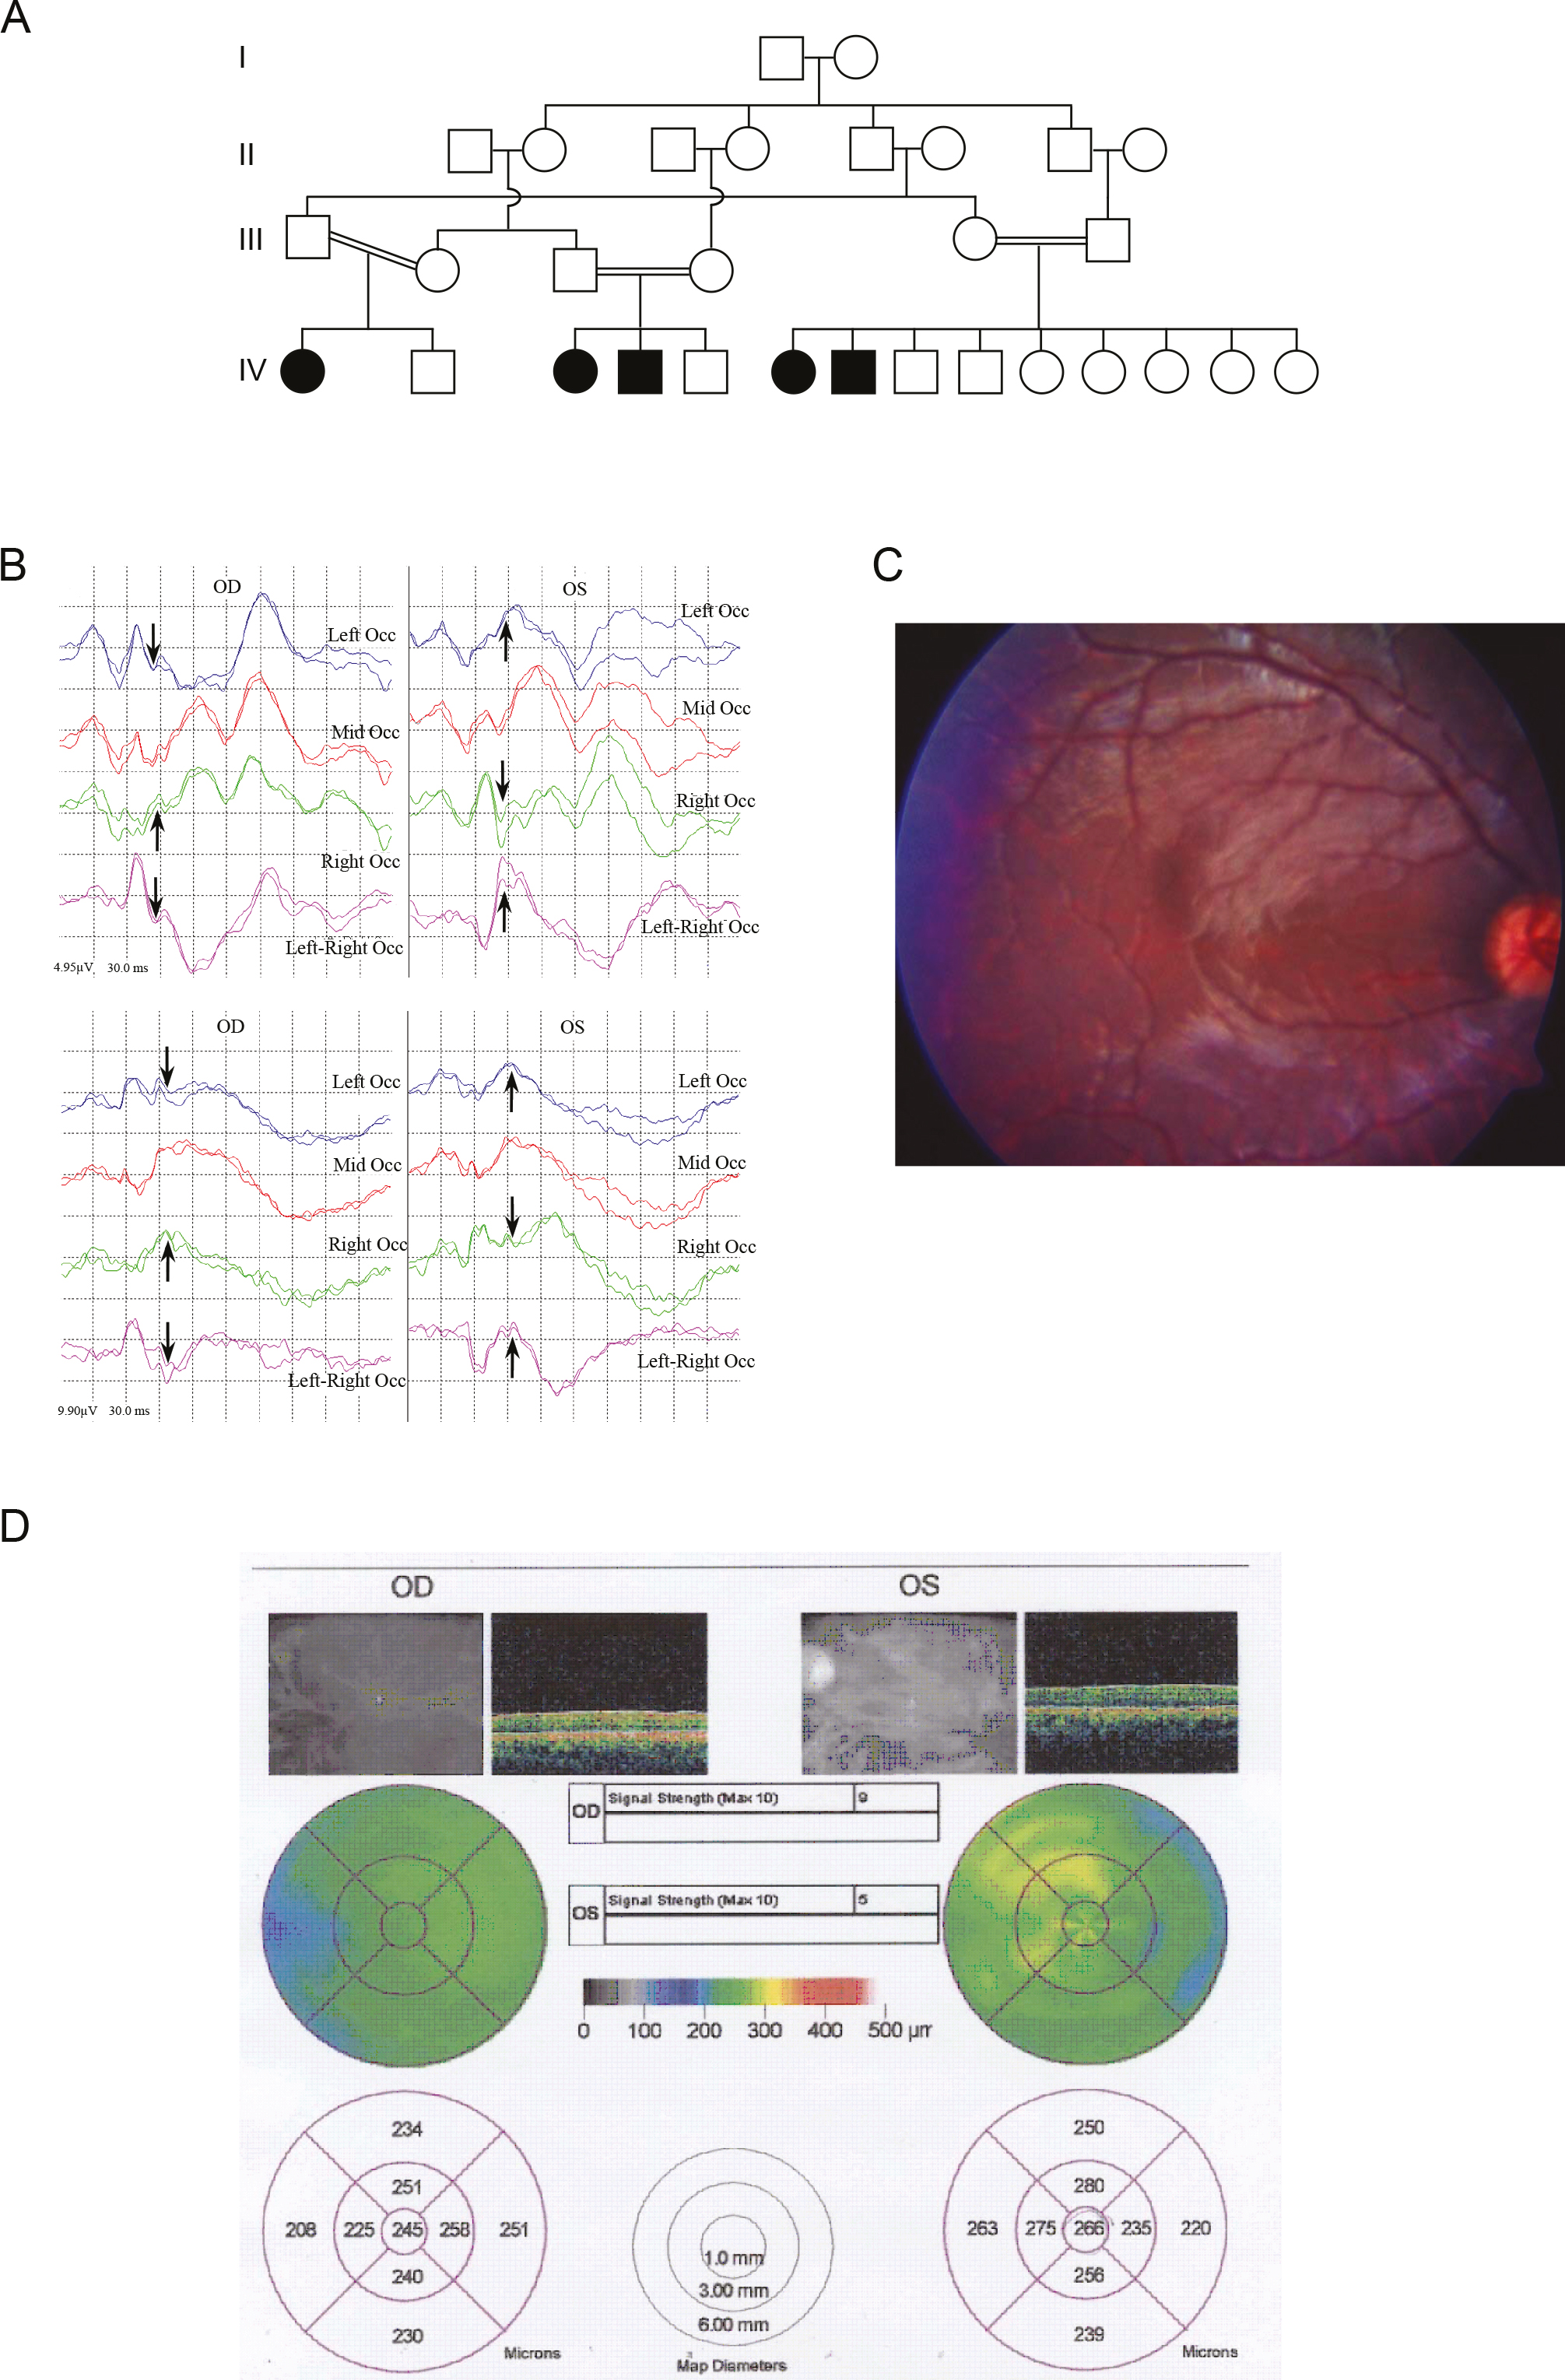
 Figure 1 of
Al-Araimi, Mol Vis 2013; 19:2165-2172.
Figure 1 of
Al-Araimi, Mol Vis 2013; 19:2165-2172.