Figure 5. Relative Fgf2 mRNA in retina among the different treatment groups after 4 weeks of subretinal electrical stimulation. Subretinal electrical
stimulation (SES)–treated eyes in the microphotodiode array (MPA) only, Low 1X, and Low 3X groups had greater Fgf2 expression than the control group (* symbol). Fgf2 expression in the MPA-only group was also greater than expression in the High 1X group (# symbol, p<0.05 post-hoc Holm-Sidak test for all statistical tests). Error bars represent ±SEM.
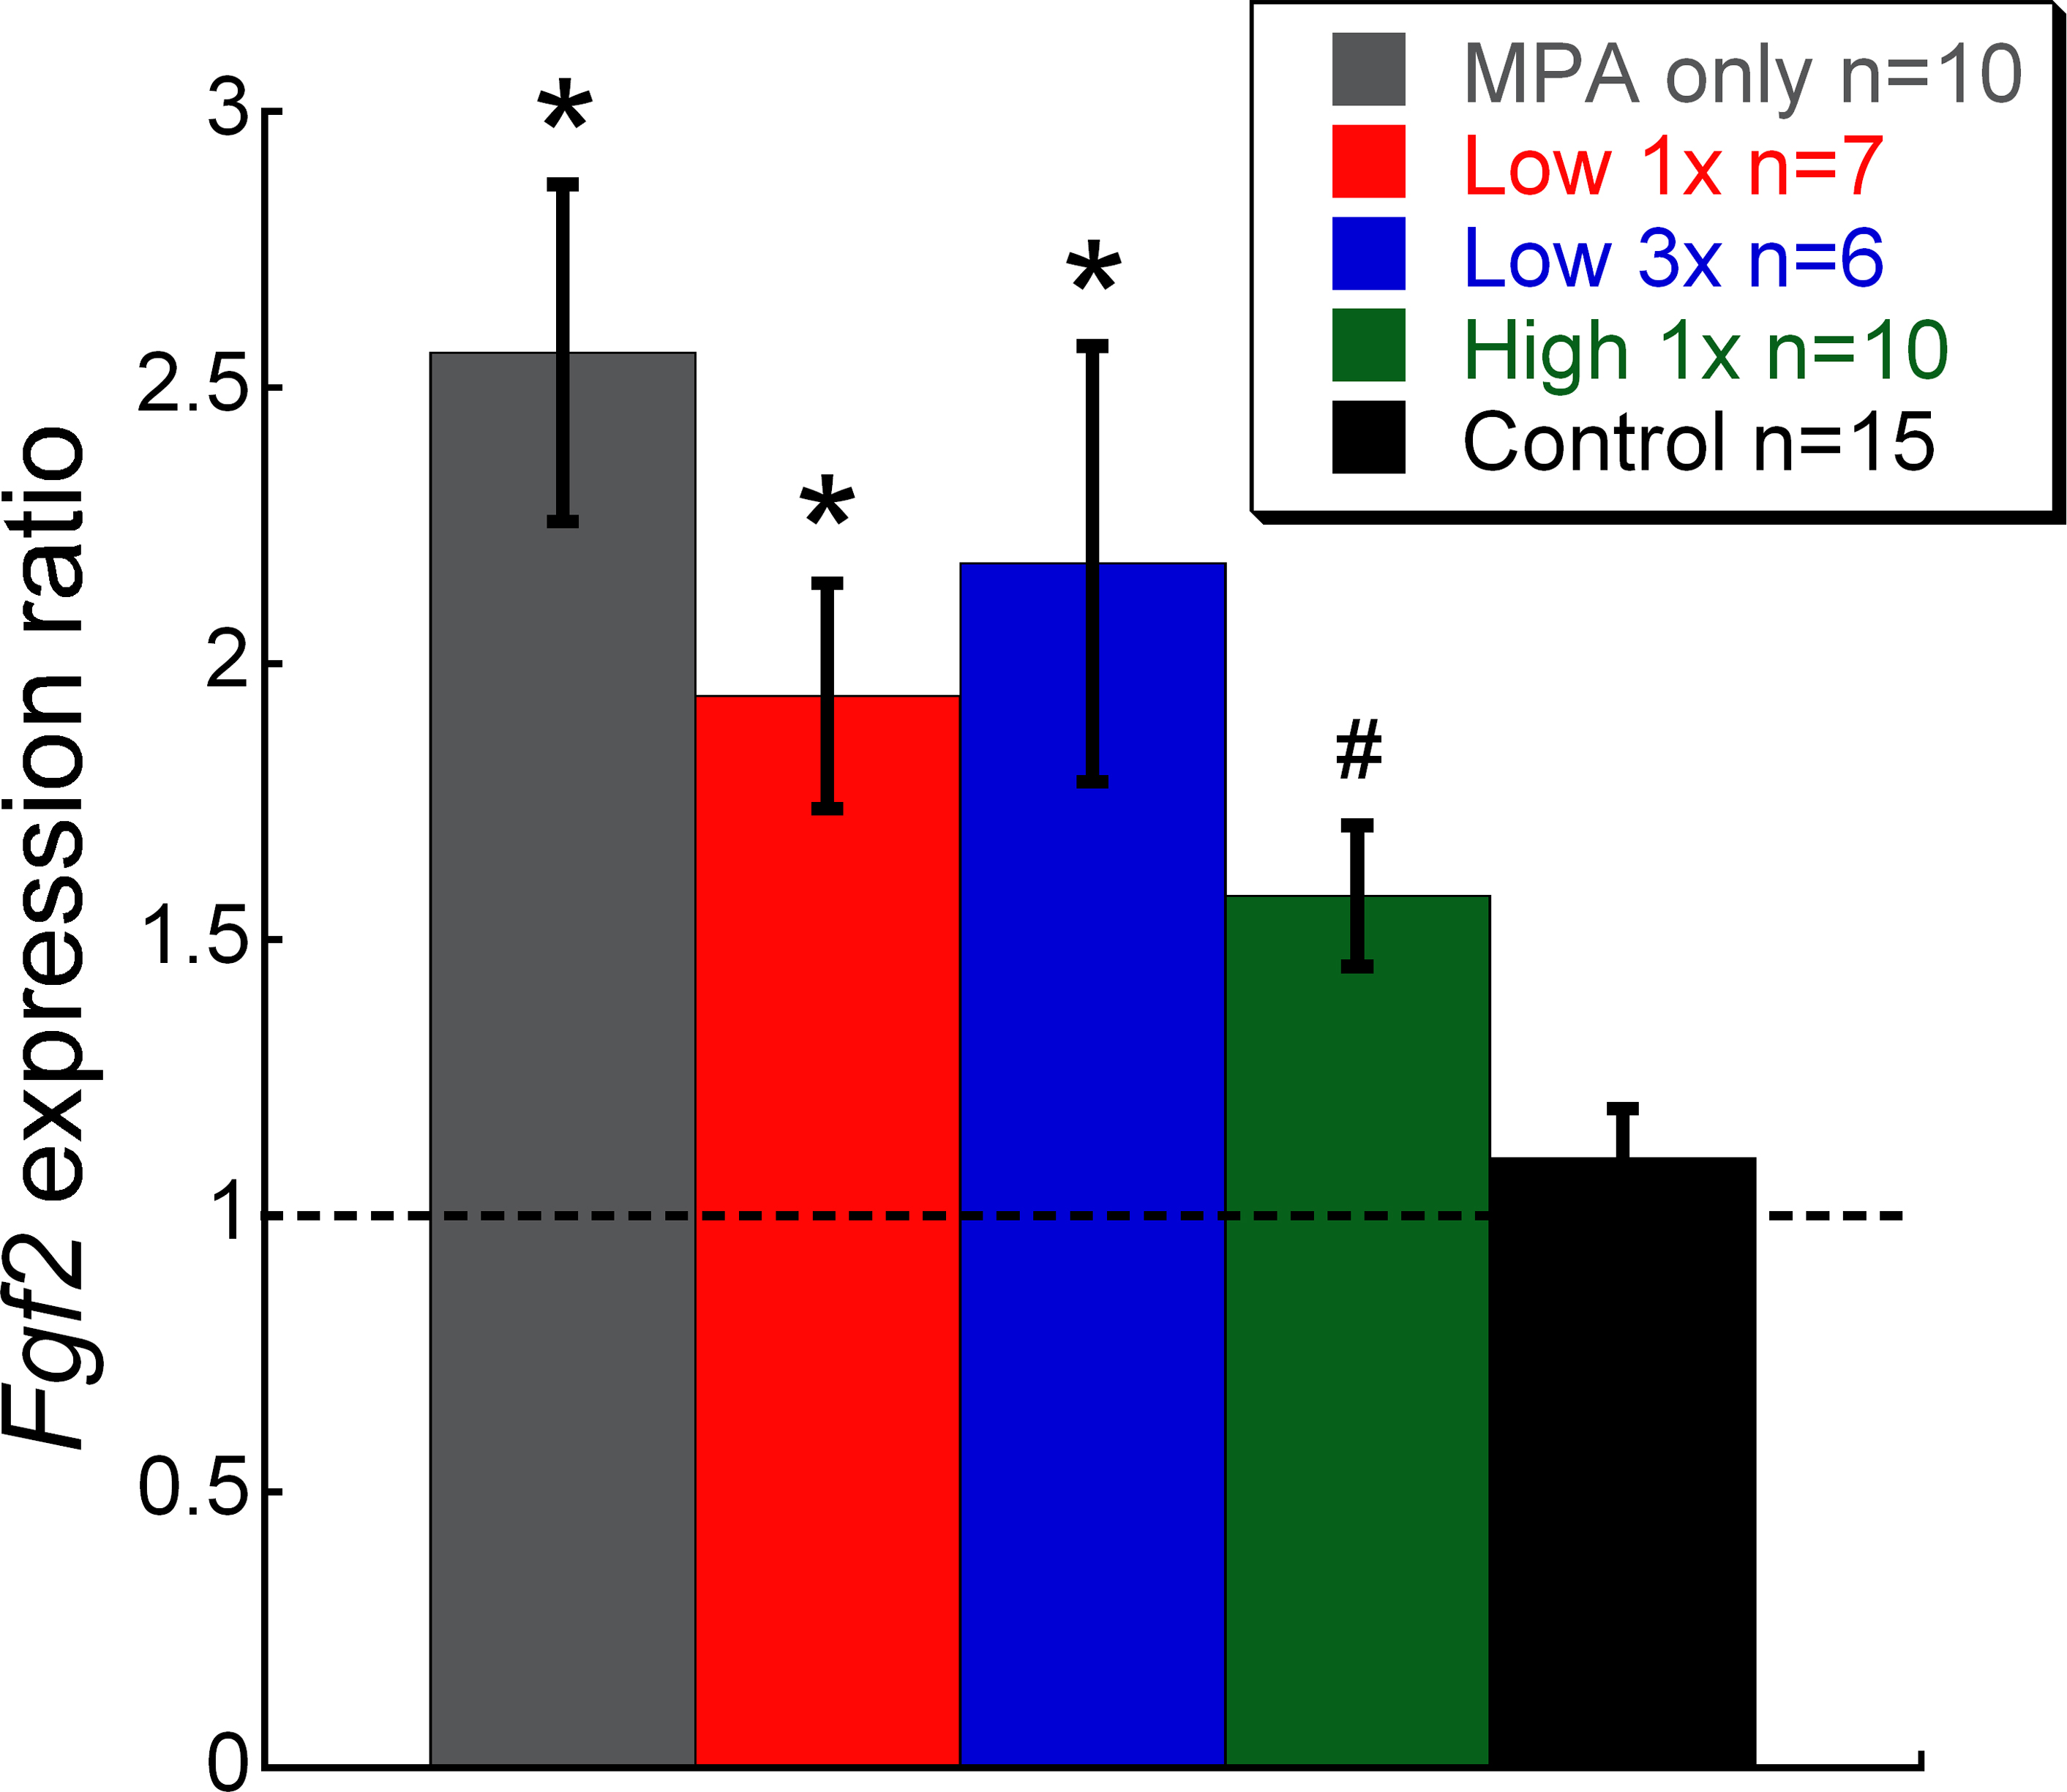
 Figure 5 of
Ciavatta, Mol Vis 2013; 19:995-1005.
Figure 5 of
Ciavatta, Mol Vis 2013; 19:995-1005.