Figure 4. Subretinal electrical stimulation (SES) preserved inner retinal function as measured by oscillatory potential (OP) amplitudes.
A: Representative oscillatory potential (OP) waveforms in response to a bright flash (1.4 log cd s/m2) at 4 weeks, showing larger amplitude responses in the subretinal electrical stimulation (SES)-treated eye. B: Maximum OPs 1–6 amplitude ratios after 4 weeks of SES. Treatment with SES resulted in larger OPs 1–4 amplitude ratios in
SES-treated eyes compared to the controls (p=0.016 for OP 1 and p<0.001 for OPs 2–4). The later OP amplitude ratios (OP 5
and OP 6) were not different between SES-treated and control eyes. Error bars represent ±SEM.
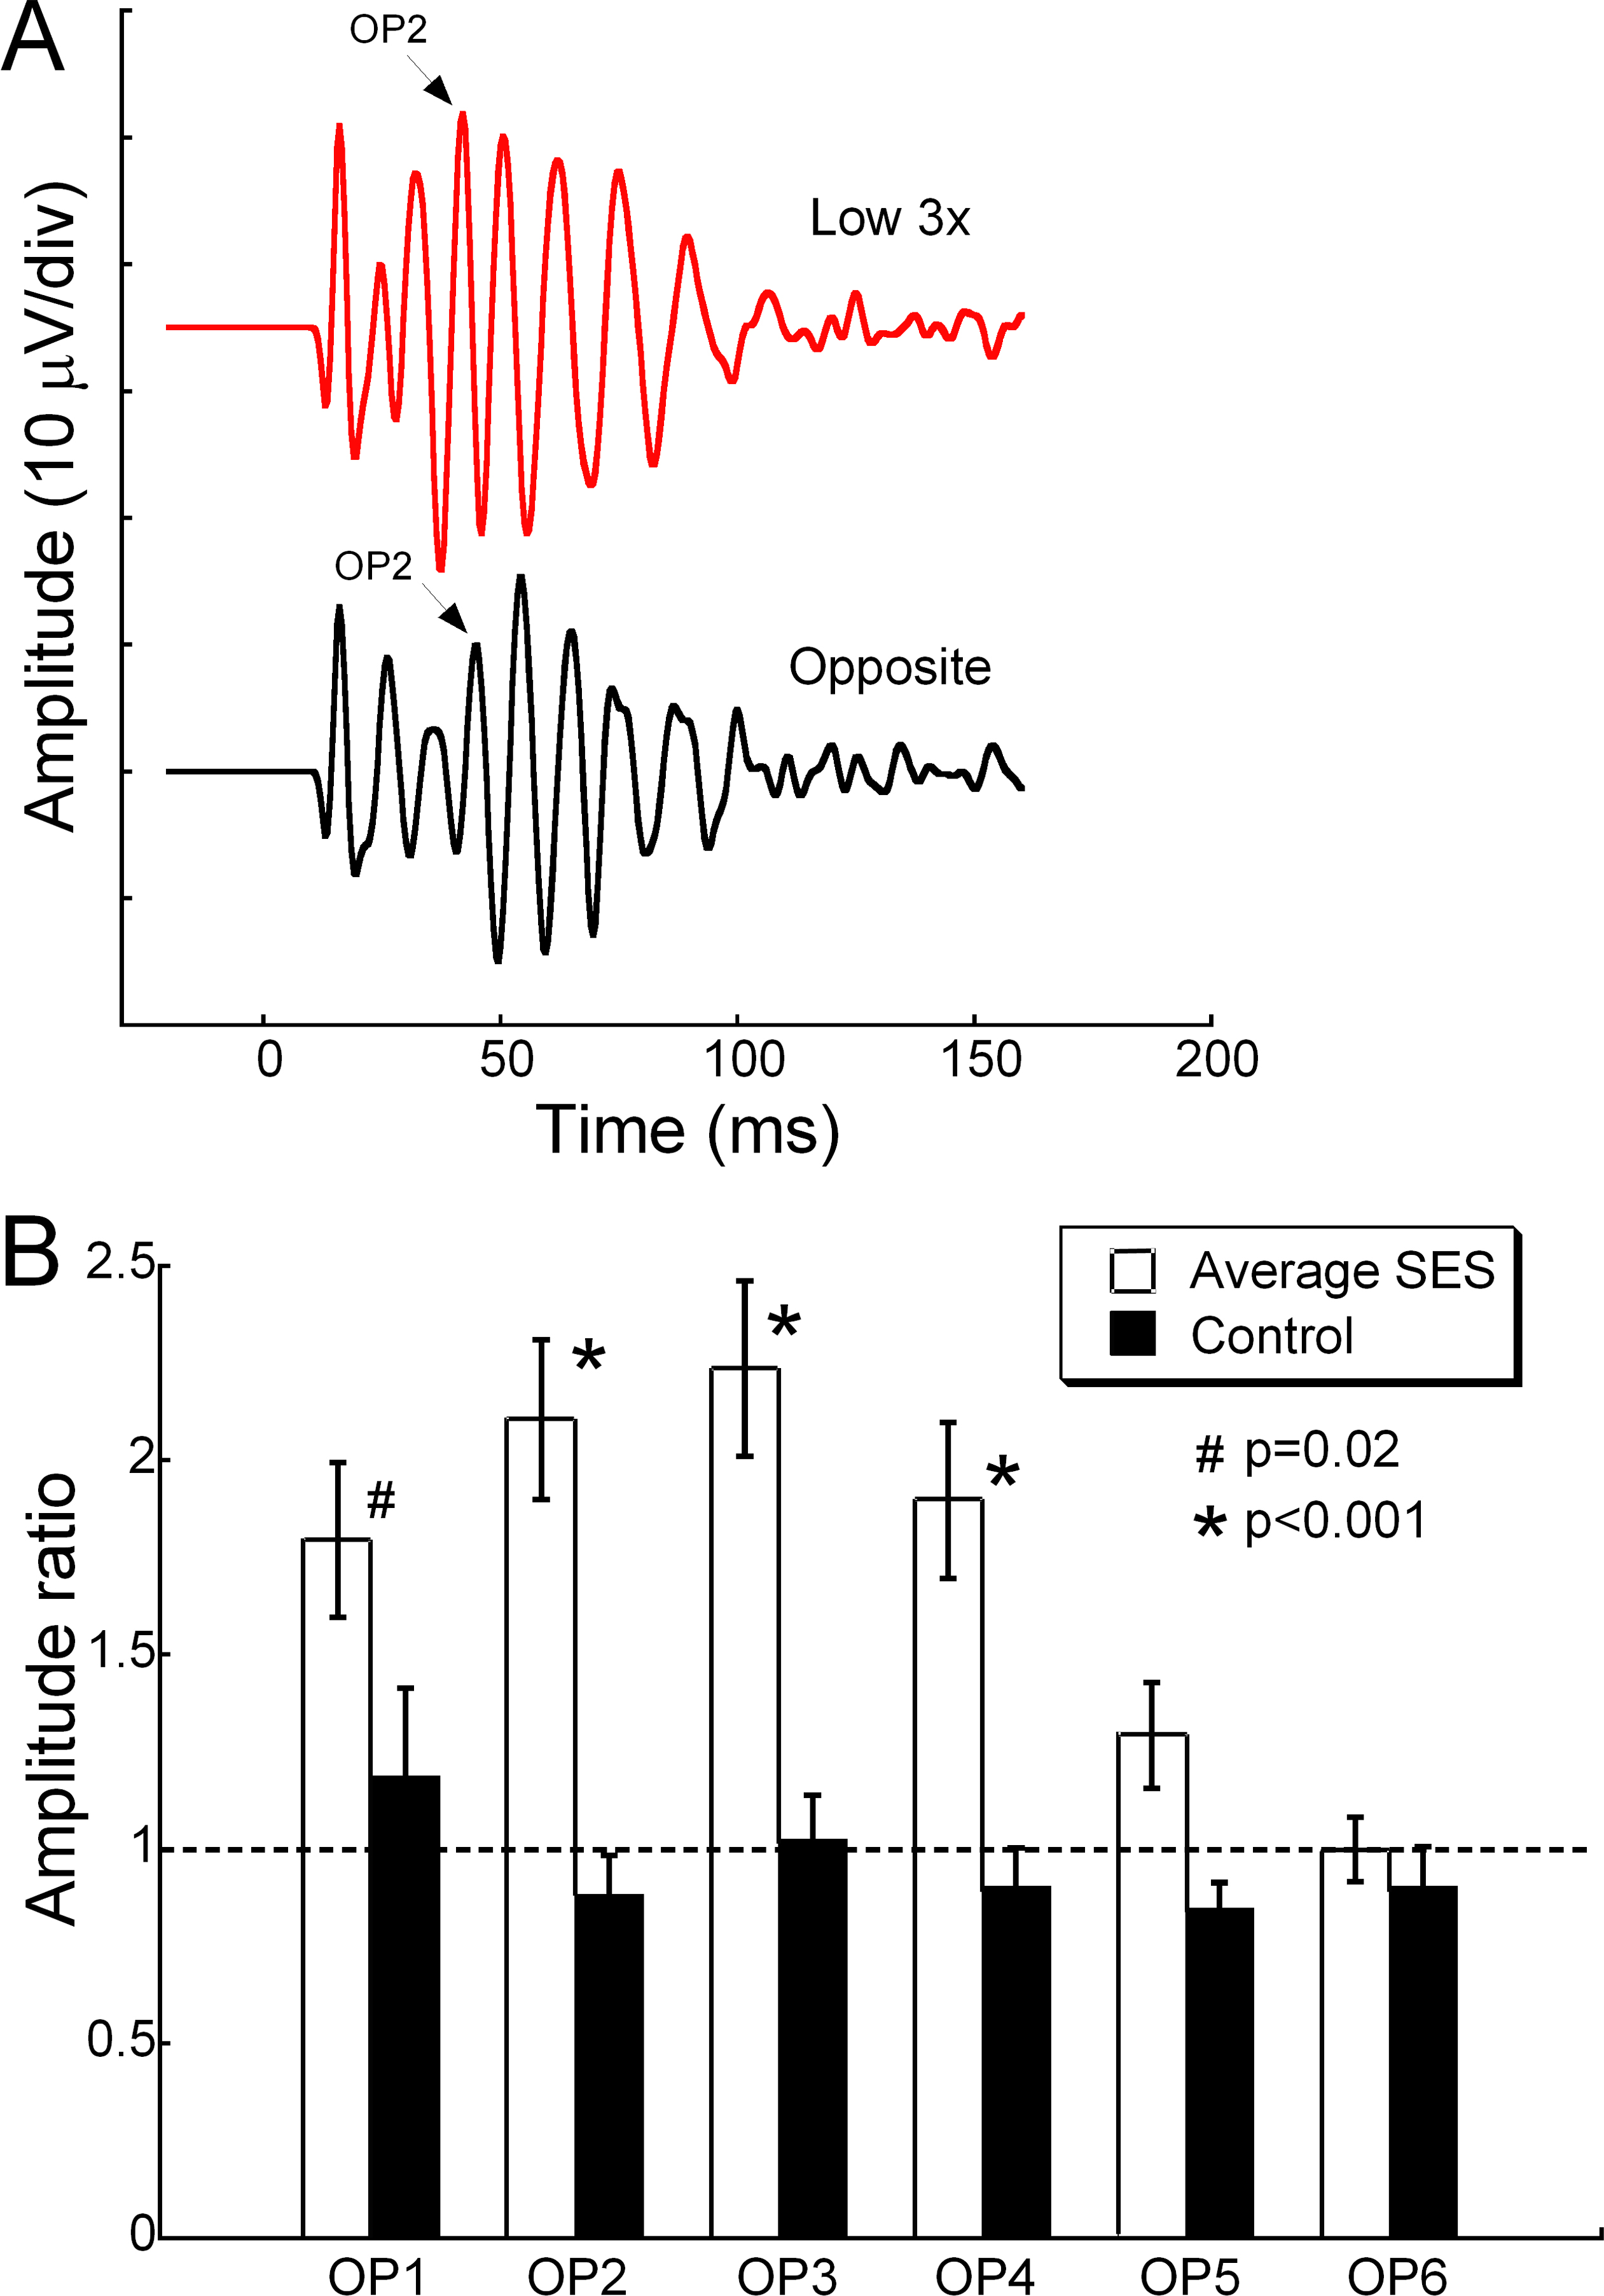
 Figure 4 of
Ciavatta, Mol Vis 2013; 19:995-1005.
Figure 4 of
Ciavatta, Mol Vis 2013; 19:995-1005.