Figure 1. Western blot. Panel A s an example of MUC1 western blot from impression cytology samples (membrane bound mucin 1 [MUC1]). Lanes 1–19 are participant
samples. Lanes 20–23 are MUC1 standards (CA15–3; 0.1, 0.2, 0.4, and 0.6 units). MW are molecular weight markers from 41 to
460 kDa (kD) beside the accompanying band. Panel B is an example of MUC1 western blot from tear samples (soluble MUC1). Lanes 1–17 are participant samples. Lanes 18–21 are
MUC1 standard (CA15–3; 0.1, 0.4, 0.8, and 1 unit). C: The sample regression curve (from A) was created by graphing applied concentration of MUC1 standard (CA15–3) against the optical density of the resulting band
immunoreactivity. Total MUC1 concentration was quantified by interpolation from this curve. For analysis purposes, all sample
chemiluminescent signals at and above 150 kDa were used.
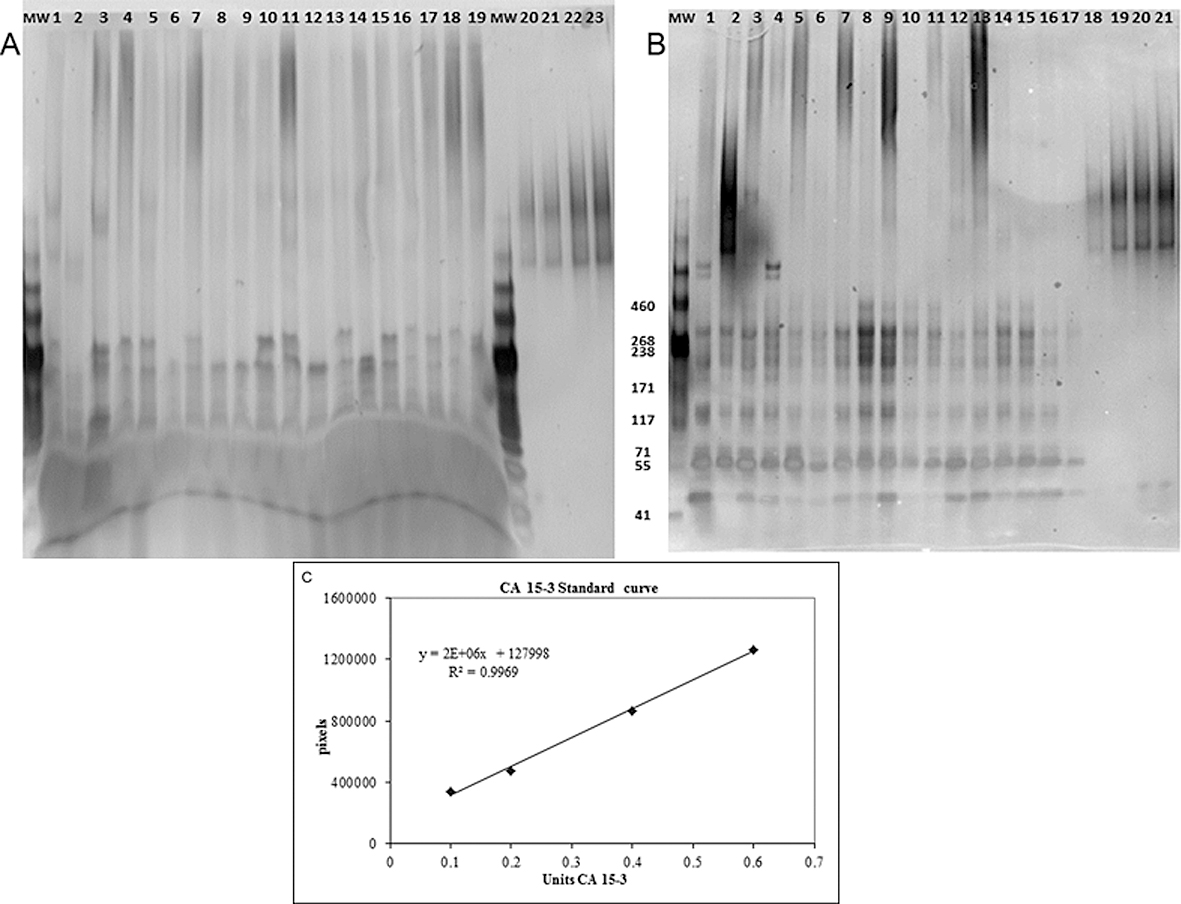
 Figure 1 of
Srinivasan, Mol Vis 2013; 19:970-979.
Figure 1 of
Srinivasan, Mol Vis 2013; 19:970-979.