Figure 2 of
Cheng, Mol Vis 2013; 19:955-969.
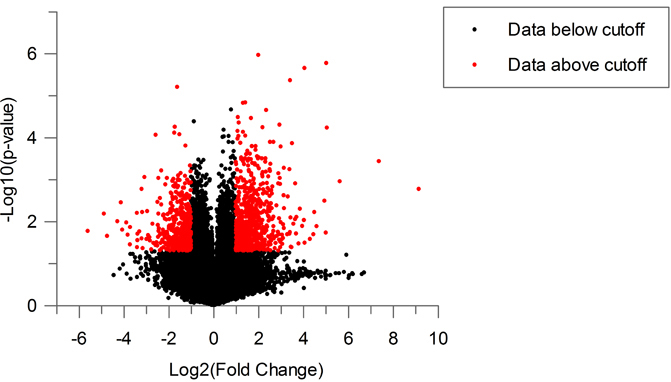
Figure 2.
The proportion of significantly differentially expressed genes graphically presented in a volcano plot. Red points represent genes that pass the p<0.05 cutoff and have a fold change of greater than 2 (Log
2
=1).
 Figure 2 of
Cheng, Mol Vis 2013; 19:955-969.
Figure 2 of
Cheng, Mol Vis 2013; 19:955-969.