Figure 3. C-terminal-binding protein 2 (CtBP2) immunostaining at ribbons is brighter in C-terminal-binding protein 1 (CtBP1)-knockout
retina. A: Histograms of pixel intensity were accumulated from a series of 868-μm2 images centered on the outer plexiform layer (OPL) of wild-type (WT; black trace) and CtBP1-knockout (KO; gray trace) retinas.
The pixel count per bin (ordinate) is on a logarithmic scale. The WT histogram presents results from ten images. The KO histogram
presents results from 13 images. The inset shows examples of individual images from WT (left) and KO (right) retina. The scale
bar in the inset equals 10 μm. B: Histograms of pixel intensity were measured in the same way for the inner plexiform layer (IPL). WT and KO histograms present
results from nine images. The inset shows examples of individual images from WT (left) and KO (right) retina. The scale bar
in the inset equals 10 μm.
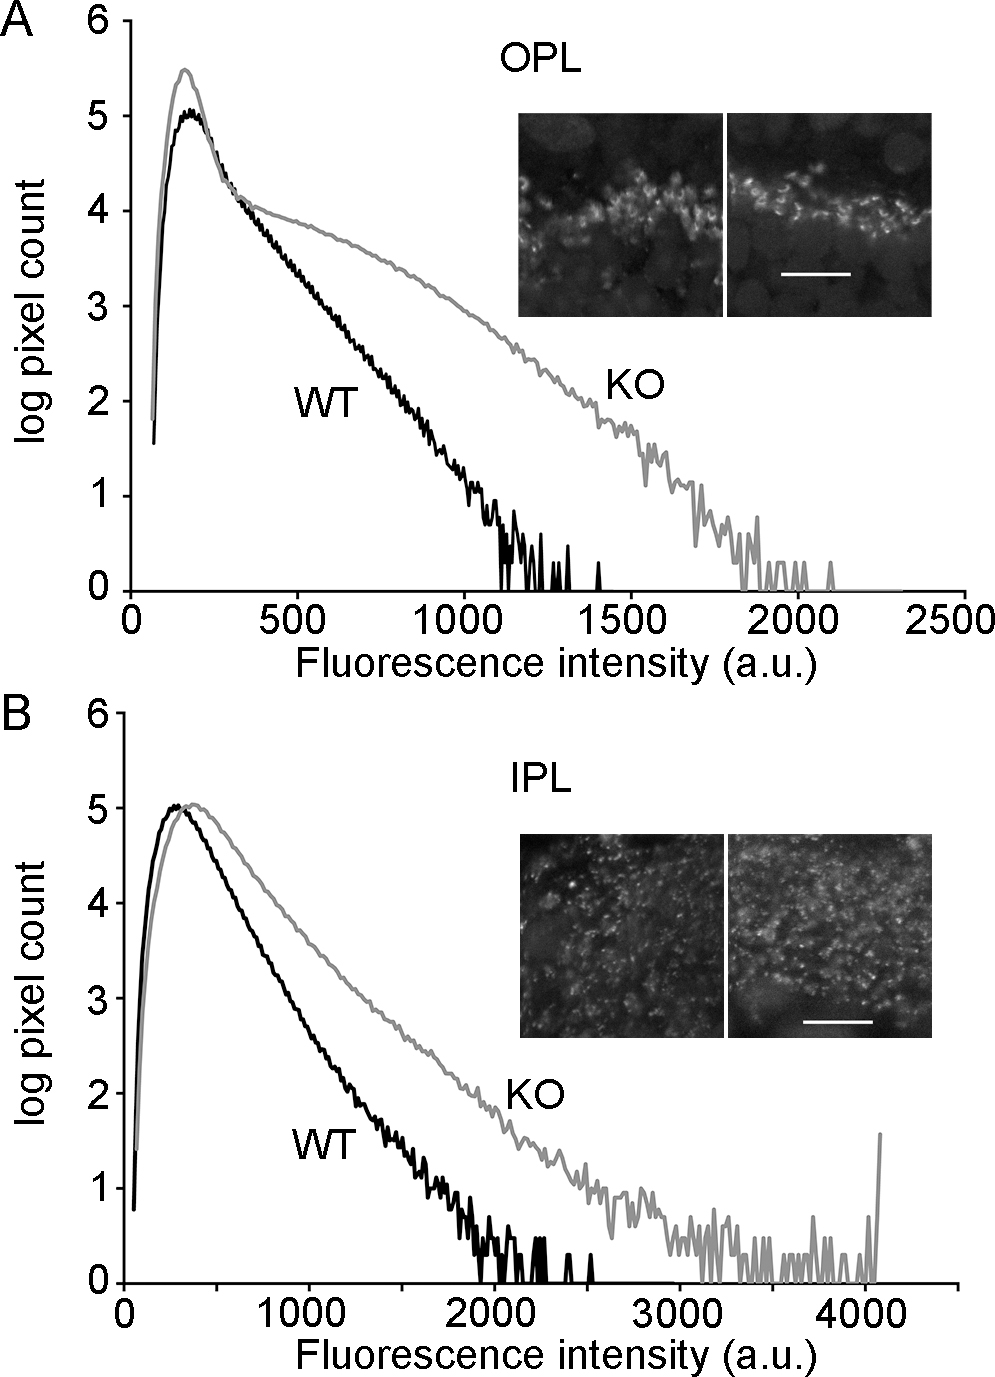
 Figure 3 of
Vaithianathan, Mol Vis 2013; 19:917-926.
Figure 3 of
Vaithianathan, Mol Vis 2013; 19:917-926.