Figure 7 of
Veiga-Crespo, Mol Vis 2013; 19:904-916.
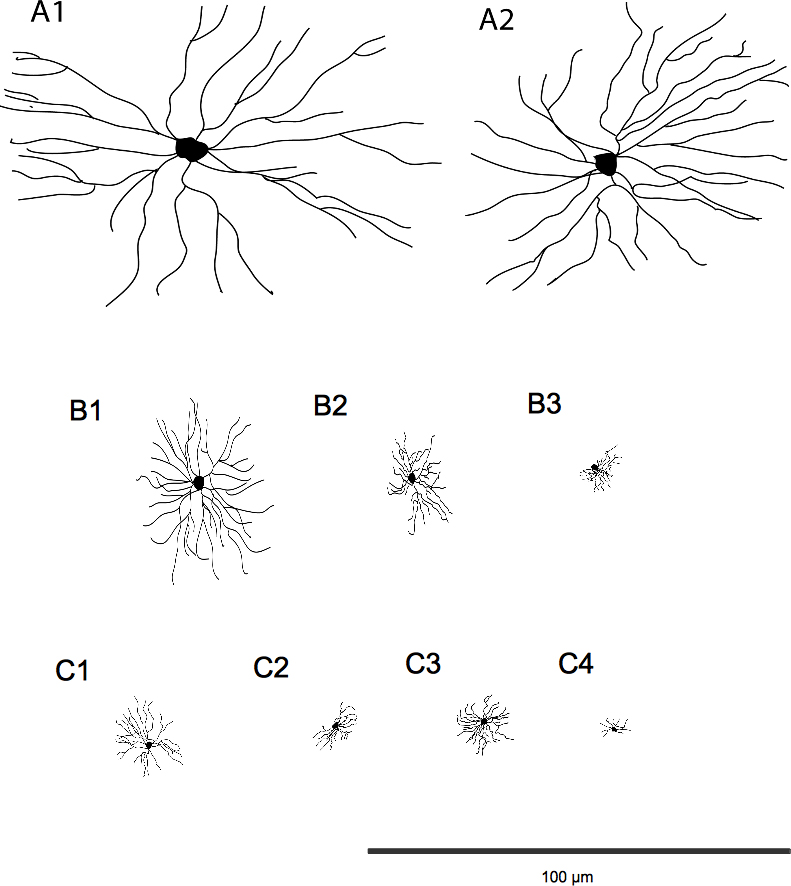
Figure 7.
Schematic diagrams of the representative models of retinal ganglion cells for the different subclusters noted above. The differences between the dendritic fields along the different subclusters can be observed. The scale bar is 100 µm.
 Figure 7 of
Veiga-Crespo, Mol Vis 2013; 19:904-916.
Figure 7 of
Veiga-Crespo, Mol Vis 2013; 19:904-916.