Figure 5. Representative pictures of the B cluster cells. Retinal ganglion cells (RGCs) representing the subclusters are shown. A: B1 subcluster contains cells with large soma areas and medium to large dendritic fields. B: B2 subcluster contains cells with medium soma areas and medium dendritic fields. C: B3 subcluster contains cells with medium soma areas and small dendritic fields. The scale bar is 50 µm. Arrows indicate
the cell belonging to the specific subcluster. D: This is a schematic representation of RGCs showing the possible branching and levels of stratification for the subclusters.
INL is the inner nuclear layer; GCL is the ganglion cell layer.
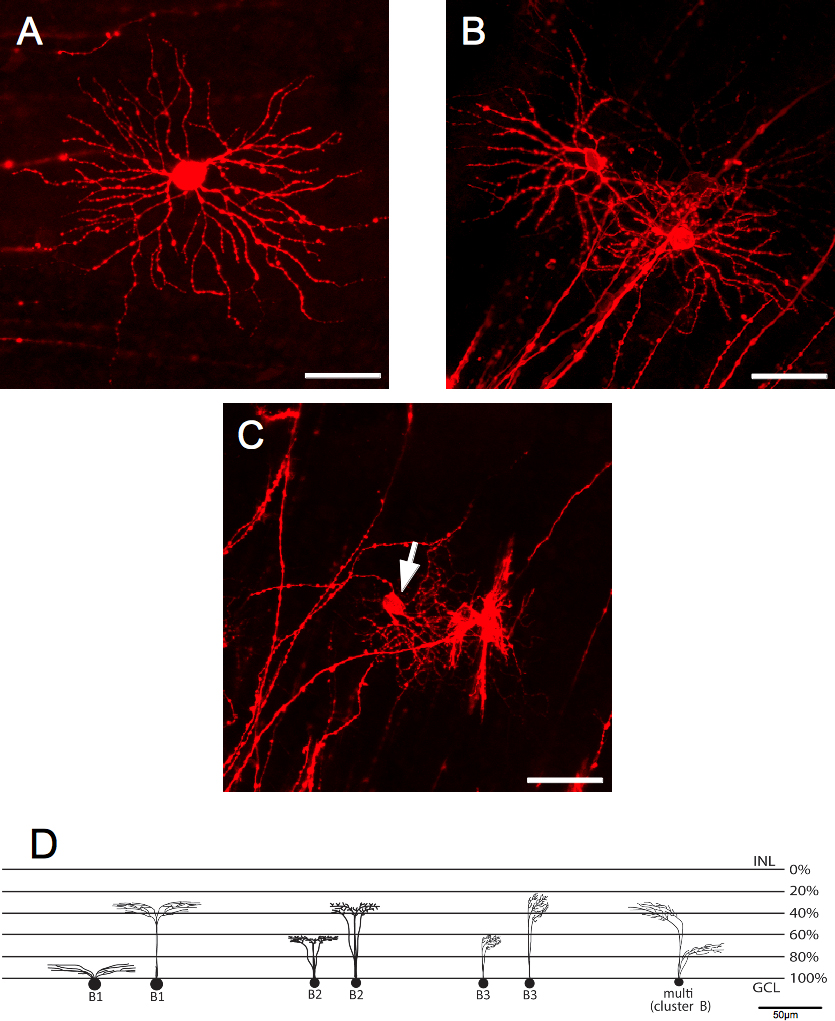
 Figure 5 of
Veiga-Crespo, Mol Vis 2013; 19:904-916.
Figure 5 of
Veiga-Crespo, Mol Vis 2013; 19:904-916.