Figure 4. Representative pictures from the A cluster. A: The A1 subcluster contains cells with the largest somas and dendritic fields from the total population. B: The cells contained in the A2 subcluster display large somas and large dendritic fields. Scale bars are 50 µm. Arrows indicate
the cell belonging to the specific subcluster. C: Schematic representation of retinal ganglion cells showing the possible branching and levels of stratification for the subclusters.
INL is the inner nuclear layer; GCL is the ganglion cell layer.
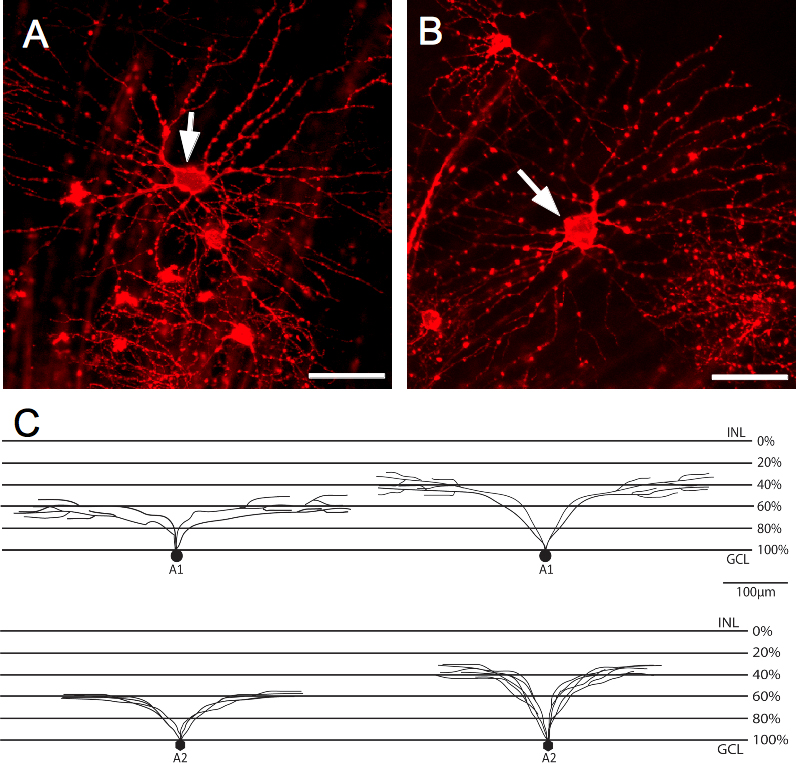
 Figure 4 of
Veiga-Crespo, Mol Vis 2013; 19:904-916.
Figure 4 of
Veiga-Crespo, Mol Vis 2013; 19:904-916.