Figure 2. Ward’s dendrogram for retinal ganglion cells. The Ward’s method showed that retinal ganglion cells (RGCs) could be differentiated
into three clusters (A, B, C). The obtained dendrogram for cluster analysis is represented here. The relative similarity of
cells (x-axis) was shown in the linkage distance (y-axis) for all RGCs analyzed (n=170). The cluster origin for the cluster
obtained in this work was designated with the corresponding letter. A continuous 3 pt-weight line divides the three main clusters
in the study.
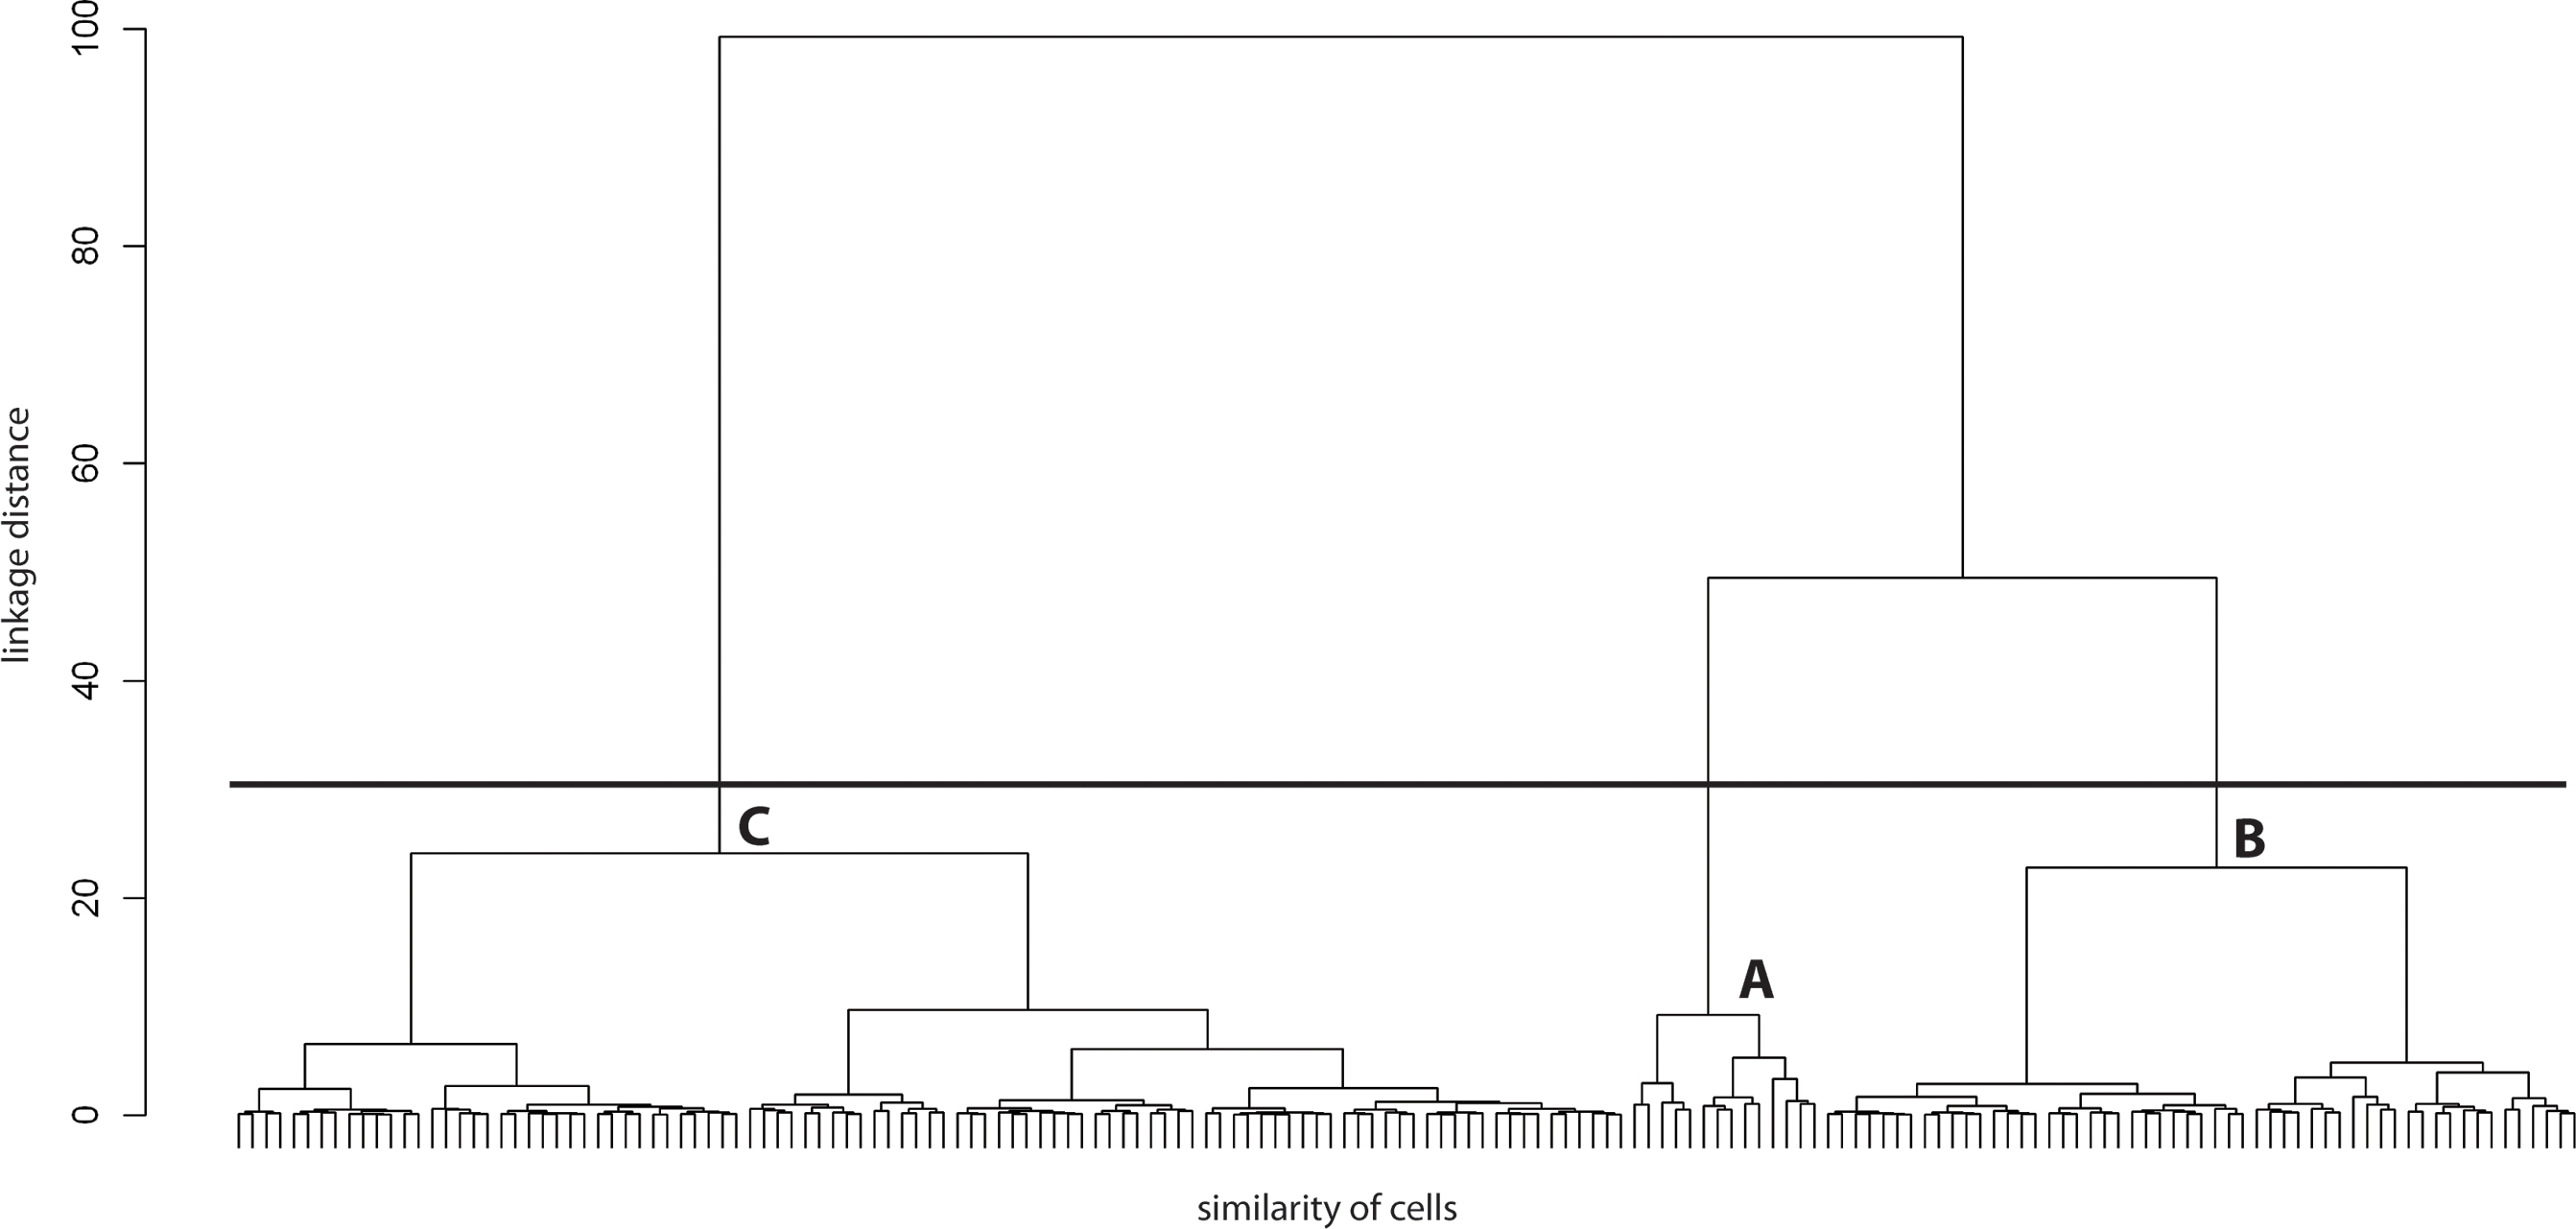
 Figure 2 of
Veiga-Crespo, Mol Vis 2013; 19:904-916.
Figure 2 of
Veiga-Crespo, Mol Vis 2013; 19:904-916.