Figure 1. Distribution of retinal ganglion cells in porcine retina with respect to their soma area sizes and dendritic field sizes.
The retinal ganglion cells (RGCs) from nine retinas were measured for three different parameters: soma major axis length,
soma area size and dendritic field area size. Cells were grouped into three different groups according to (A) soma area: <100 μm2, 100–200 μm2, >200 μm2 as well as (C) dendritic field area (<10,000 μm2, 10,000–20,000 μm2, >20,000 μm2. Major axis length and the soma area sizes of RGCs correlate linearly (B), whereas soma area 1 sizes do not correlate linearly with dendritic field area sizes (D).
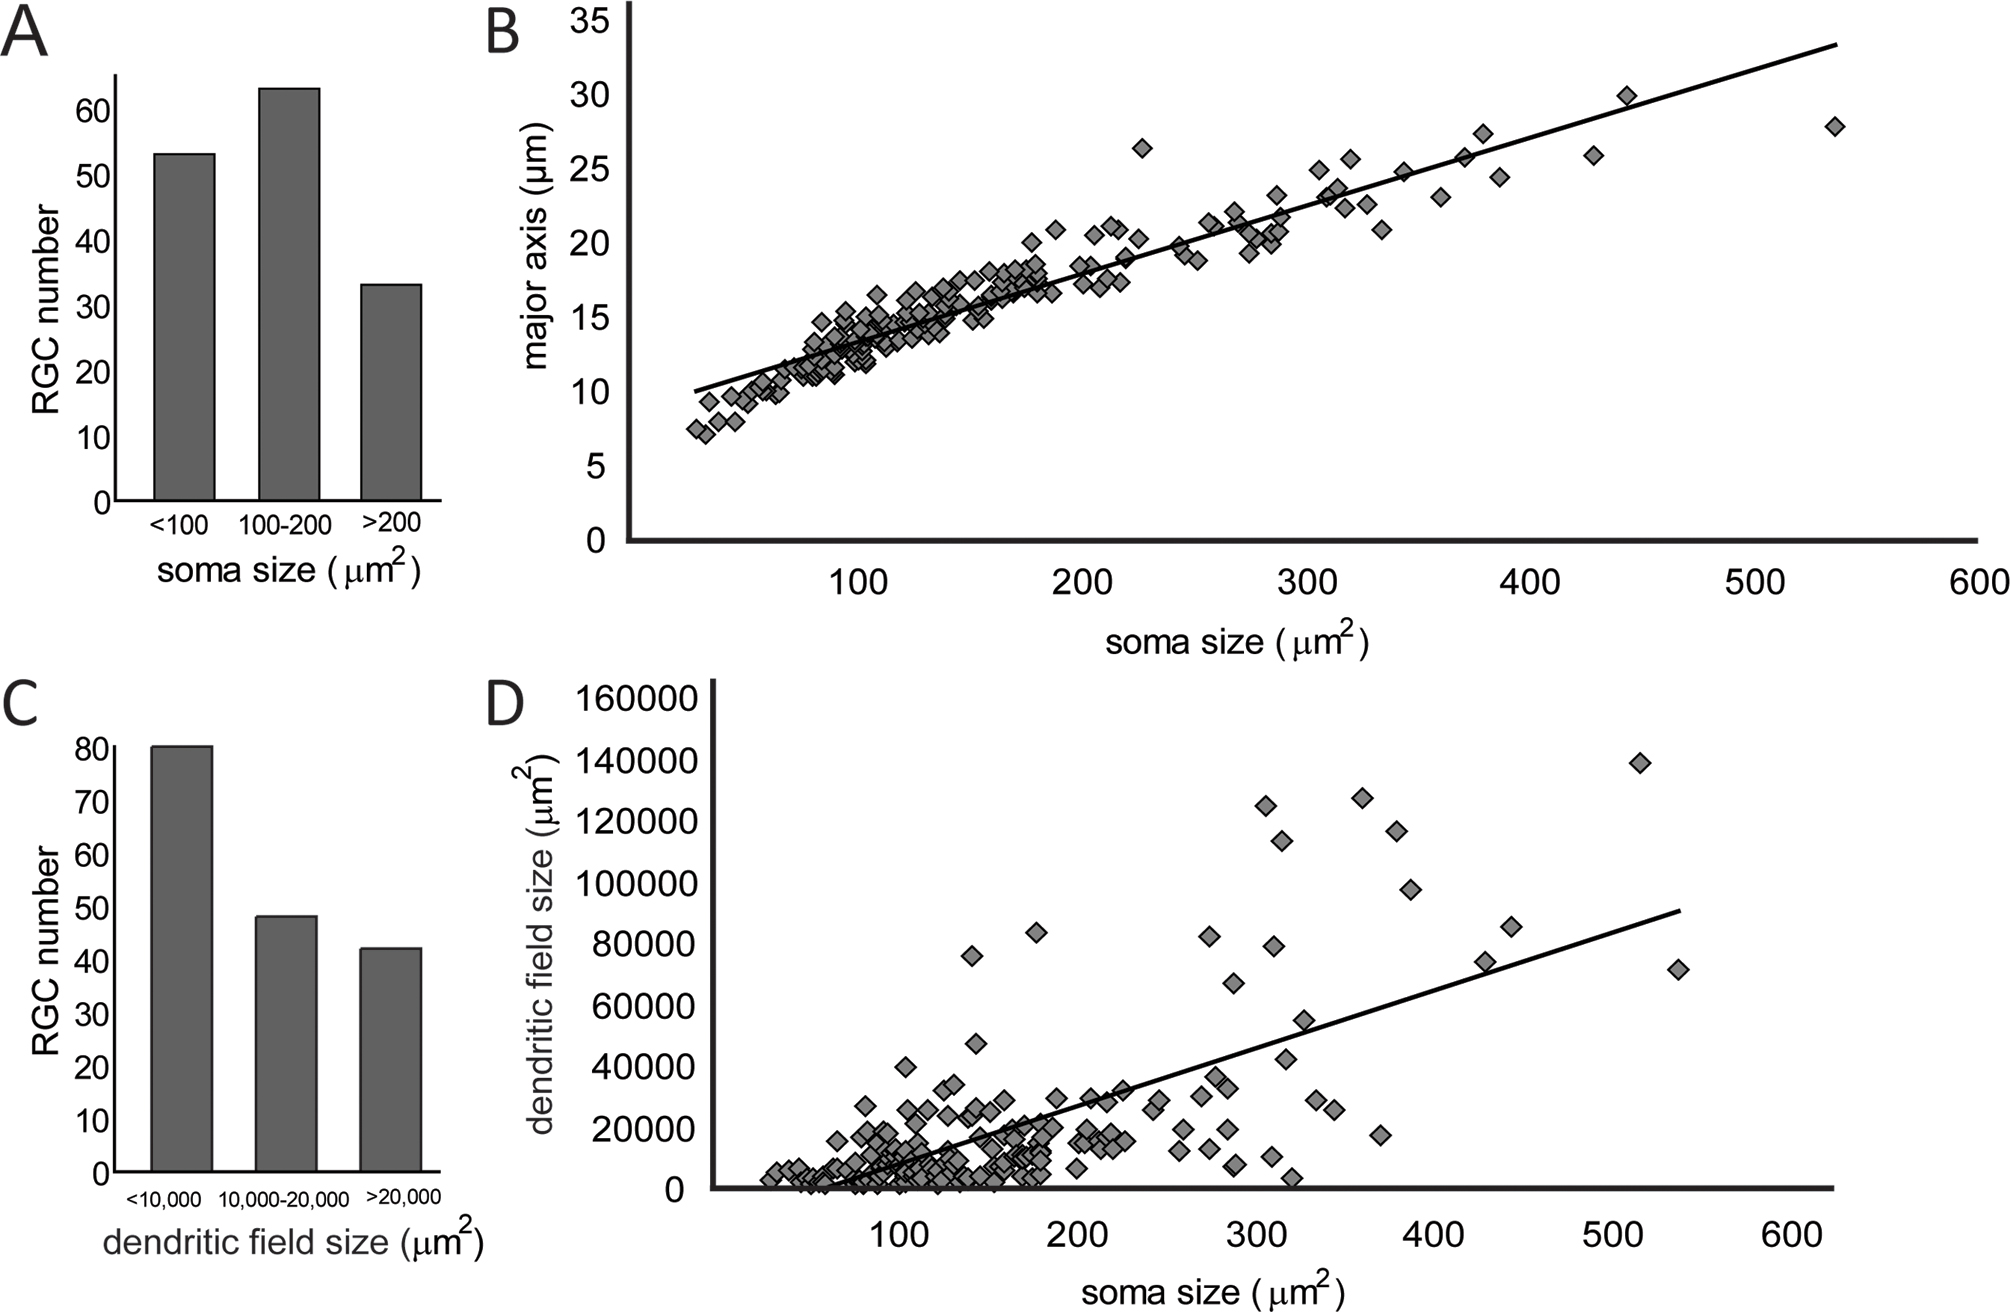
 Figure 1 of
Veiga-Crespo, Mol Vis 2013; 19:904-916.
Figure 1 of
Veiga-Crespo, Mol Vis 2013; 19:904-916.