Figure 4. High-resolution melting analysis normalized difference graph of screening in the control population (200 alleles) for the
visual system homeobox 1 gene c.731A>G, p.His244Arg heterozygous variant. The duplicate red lines running parallel to the
x-axis at zero are the positive control (affected) samples, while the samples with no variants are represented by the sine-shaped
melting curves.
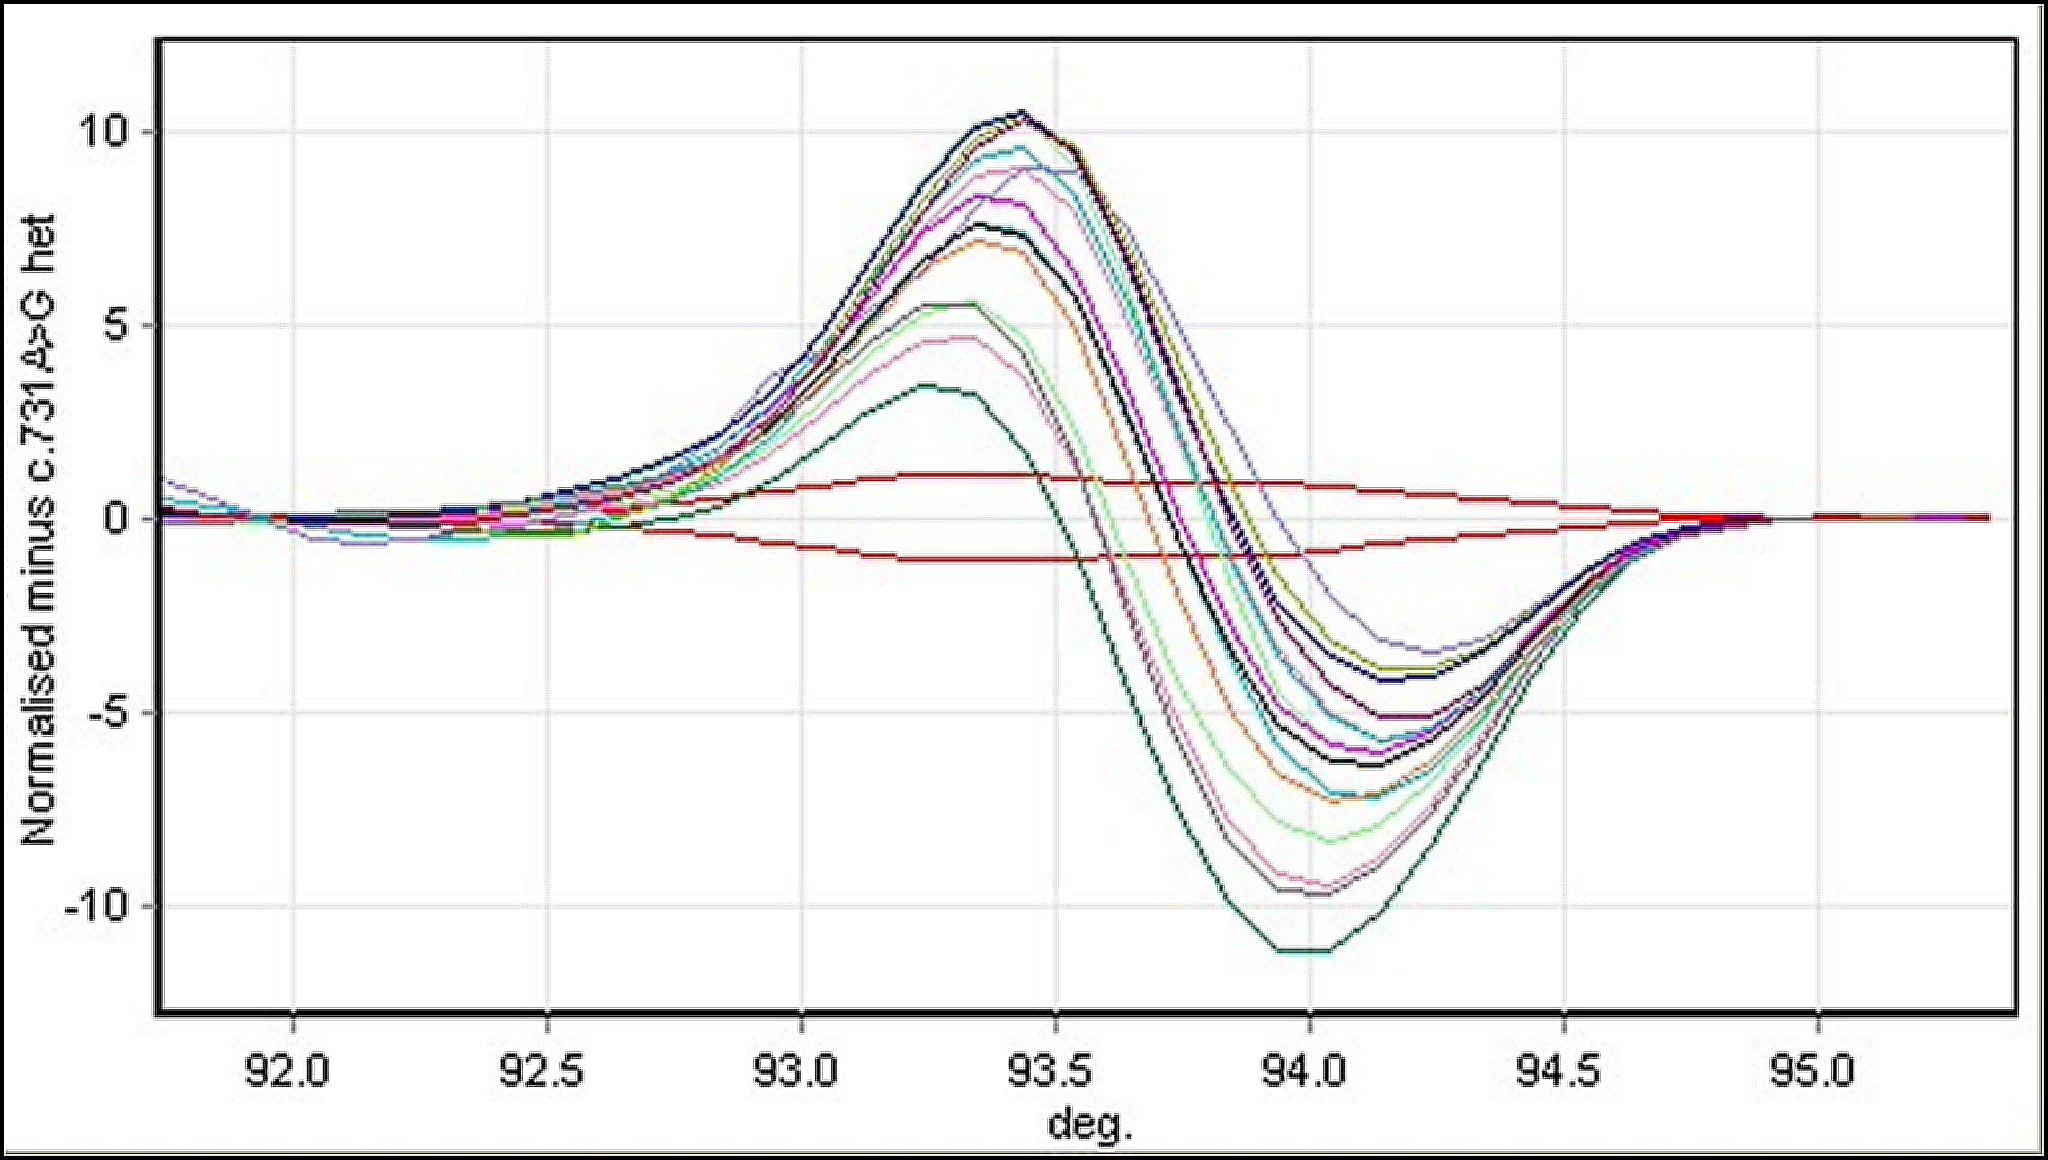
 Figure 4 of
Vincent, Mol Vis 2013; 19:852-860.
Figure 4 of
Vincent, Mol Vis 2013; 19:852-860.