Figure 2. High-resolution melting analysis normalized difference graph of screening in the control population (200 alleles) for the
VSX1 c.173C>T variant. The melt profiles shown in red at the bottom are duplicate samples of the positive control (affected c.173C>T
heterozygous) samples. All other samples with no variants are represented by the bell-shaped melting curves.
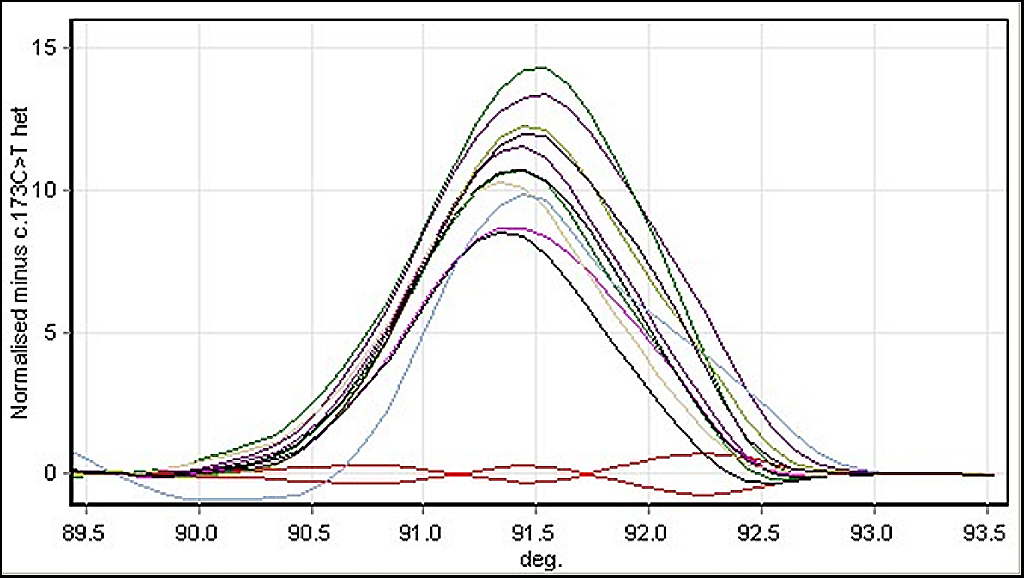
 Figure 2 of
Vincent, Mol Vis 2013; 19:852-860.
Figure 2 of
Vincent, Mol Vis 2013; 19:852-860.