Figure 1. Linkage disequilibrium plot of three interleukin 1 alpha to interleukin 1 beta single nucleotide polymorphisms in 559 study
participants. The D’ value and r2 value (in parentheses) corresponding to each single nucleotide polymorphism (SNP) pair are expressed as a percentage and
shown within the respective square. Red represents a high-pairwise D' value.
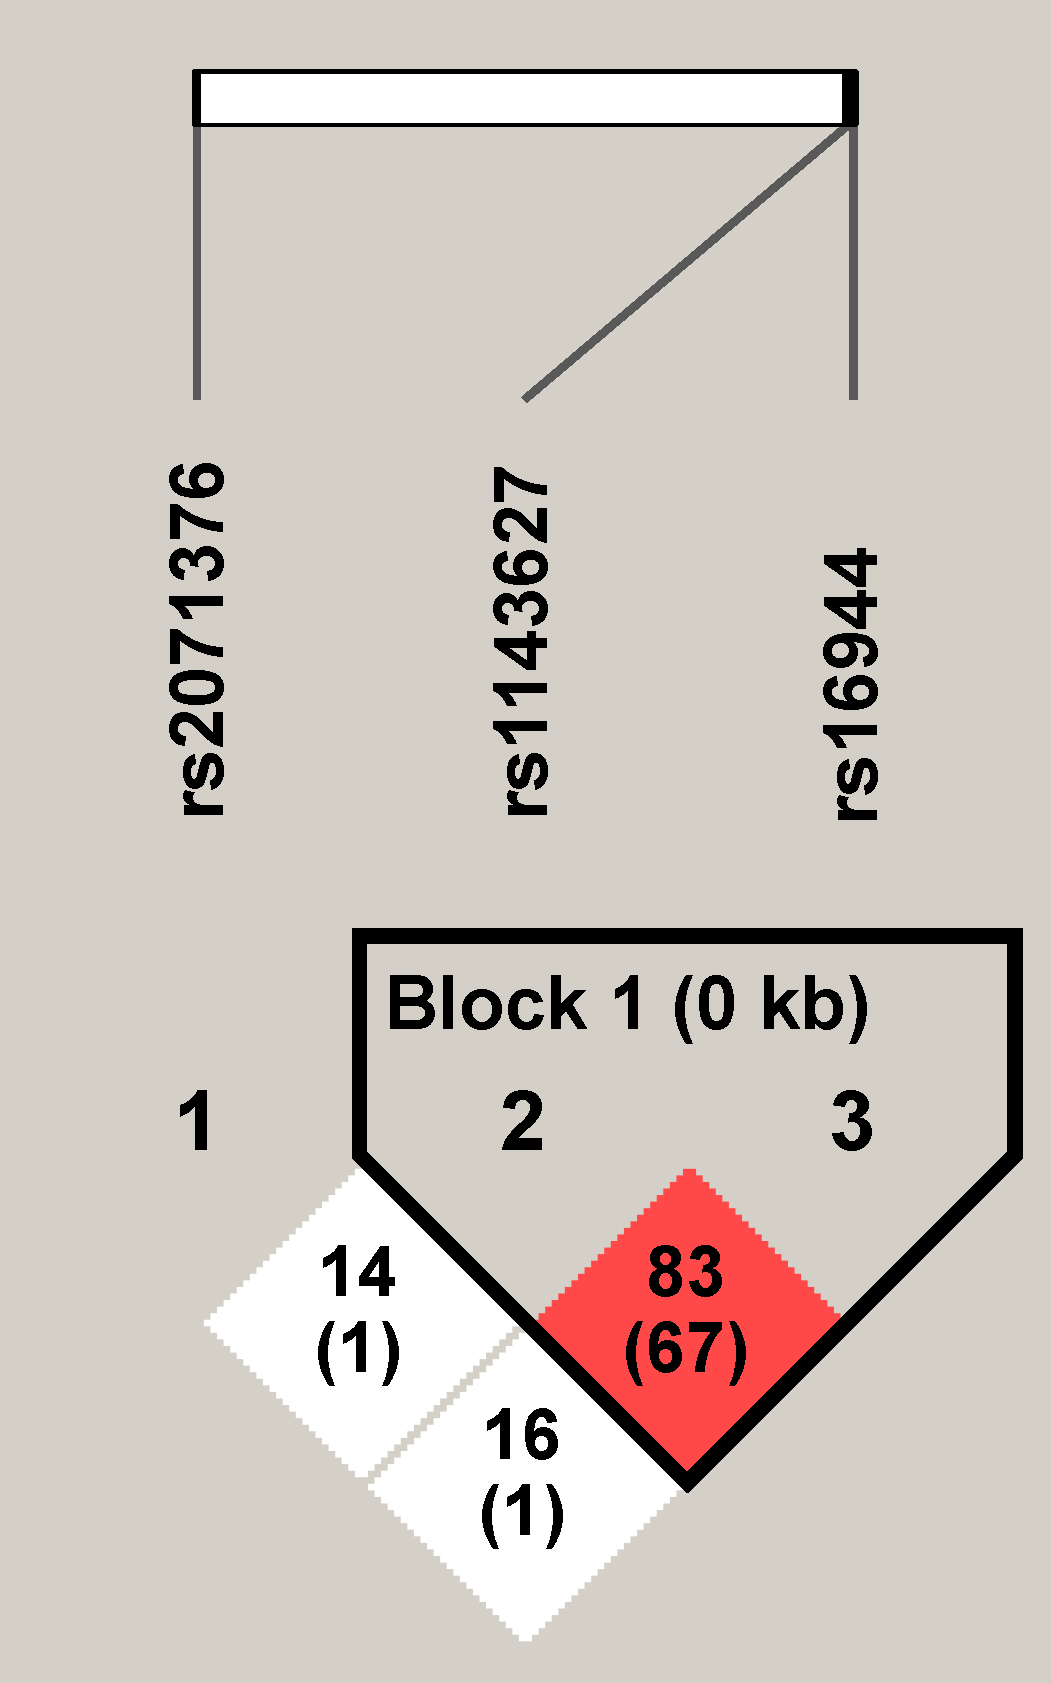
 Figure 1 of
Mikami, Mol Vis 2013; 19:845-851.
Figure 1 of
Mikami, Mol Vis 2013; 19:845-851.