Figure 1 of
Kaur, Mol Vis 2013; 19:822-828.
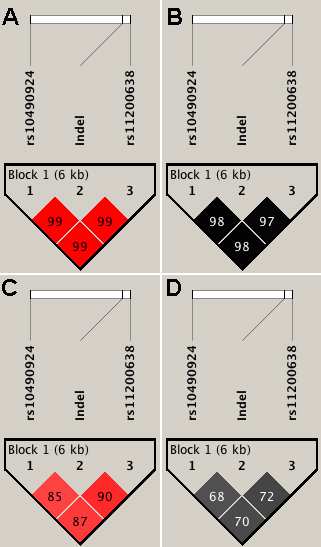
Figure 1.
Linkage disequilibrium plots showing the three variants in the Australian and Indian cohorts. The D’ and r
2
values between the SNPs are indicated inside the quadrants for the Australian (
A
and
B
) and the Indian (
C
and
D
), respectively.
 Figure 1 of
Kaur, Mol Vis 2013; 19:822-828.
Figure 1 of
Kaur, Mol Vis 2013; 19:822-828.