Figure 4. Western blotting for phosphorylated IRTyr1150/1151 to total IR and phosphorylated AktSer473 to total Akt on retinal Müller cells cultured in normal glucose (5 mM, NG) or high glucose (25 mM, HG) and treated with Compound
49b (50 nM). A representative blot is shown. Panel A is phosphorylated IRTyr1150/1151 to total IR. Panel B is phosphorylated AktSer473 to total Akt. *p<0.05 versus NG, #p<0.05 versus HG, n=4 for all groups. Data are mean±SEM.
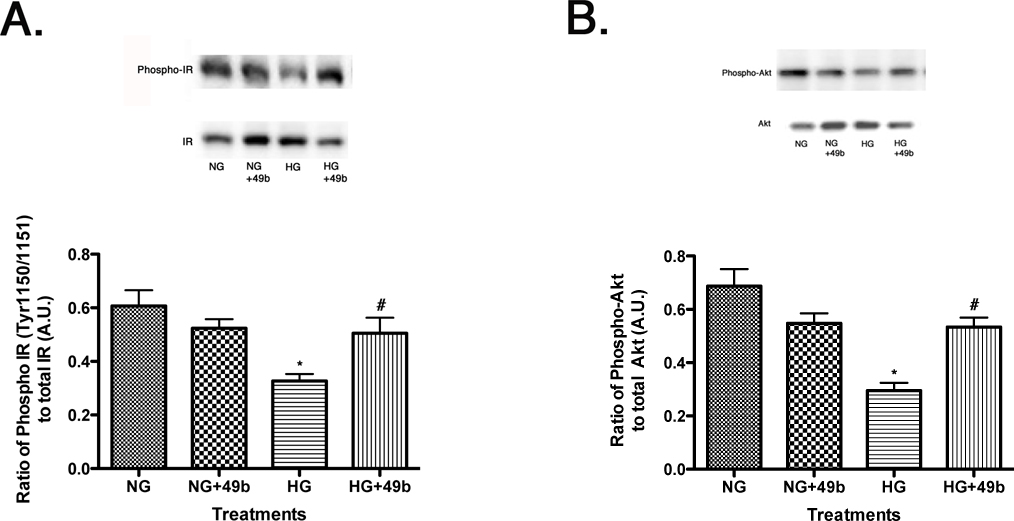
 Figure 4 of
Jiang, Mol Vis 2013; 19:804-811.
Figure 4 of
Jiang, Mol Vis 2013; 19:804-811.