Figure 2. Data are western blot results for phosphorylated IRS-1Ser307 to total IRS-1 on retinal Müller cells cultured in normal glucose (5 mM, NG) or high glucose (25 mM, HG) and treated with
Compound 49b (50 nM). A representative blot is shown. *p<0.05 versus NG, #p<0.05 versus HG, n=4 for all groups. Data are mean±SEM.
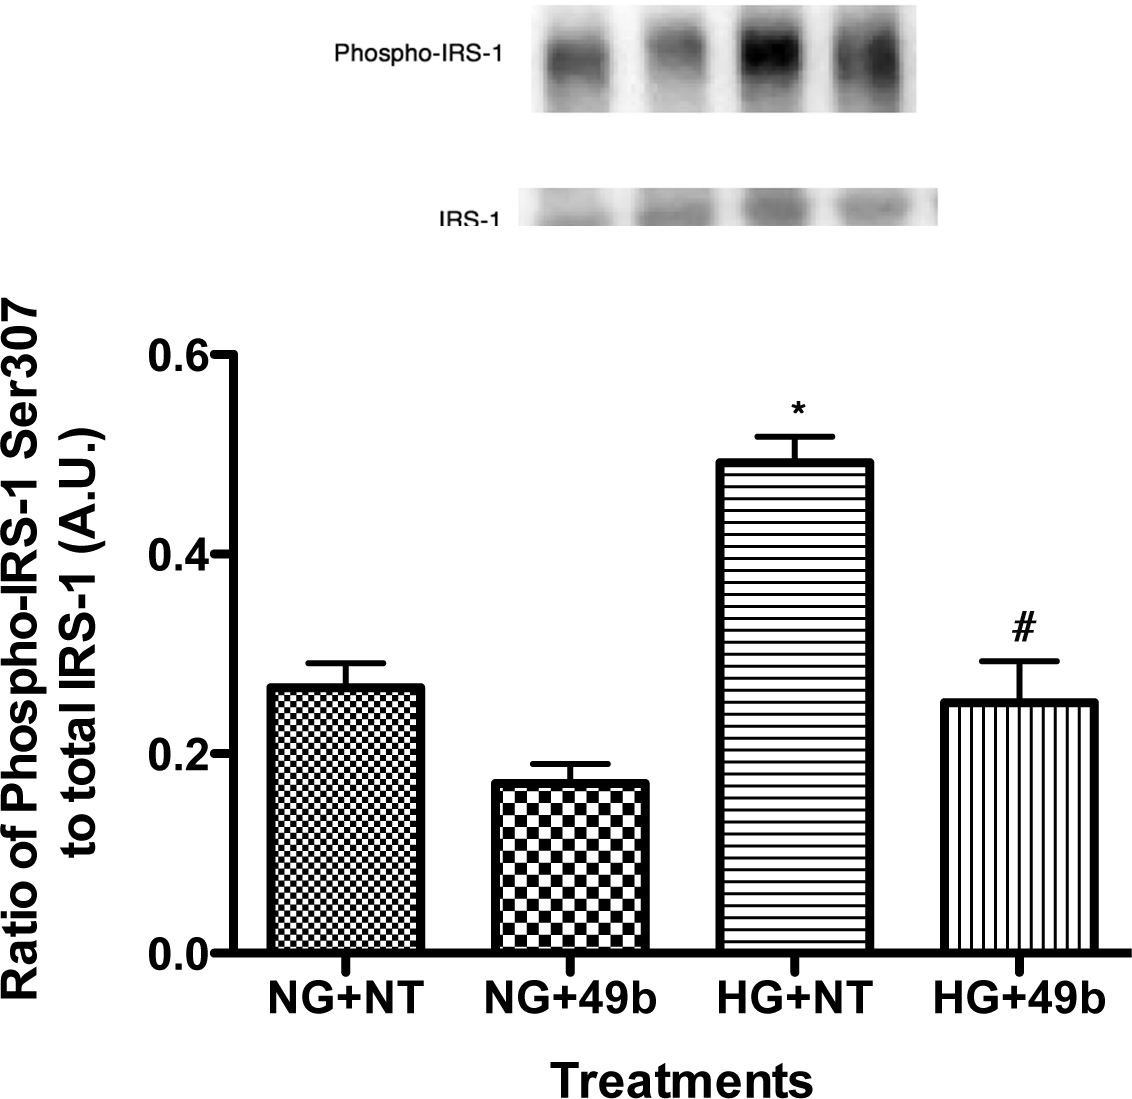
 Figure 2 of
Jiang, Mol Vis 2013; 19:804-811.
Figure 2 of
Jiang, Mol Vis 2013; 19:804-811.