Figure 5. Clustering of the regulated genes that were changed at P8-O/P8-N, P12-O/P12-N, or P13-O/P13-N during the oxygen-induced retinopathy
model induction process. Three arrays were included in each group, and the average folds-over-age controls were used. The
color bar stands for the log2 values of the probe change folds, with red for upregulation and green for downregulation.
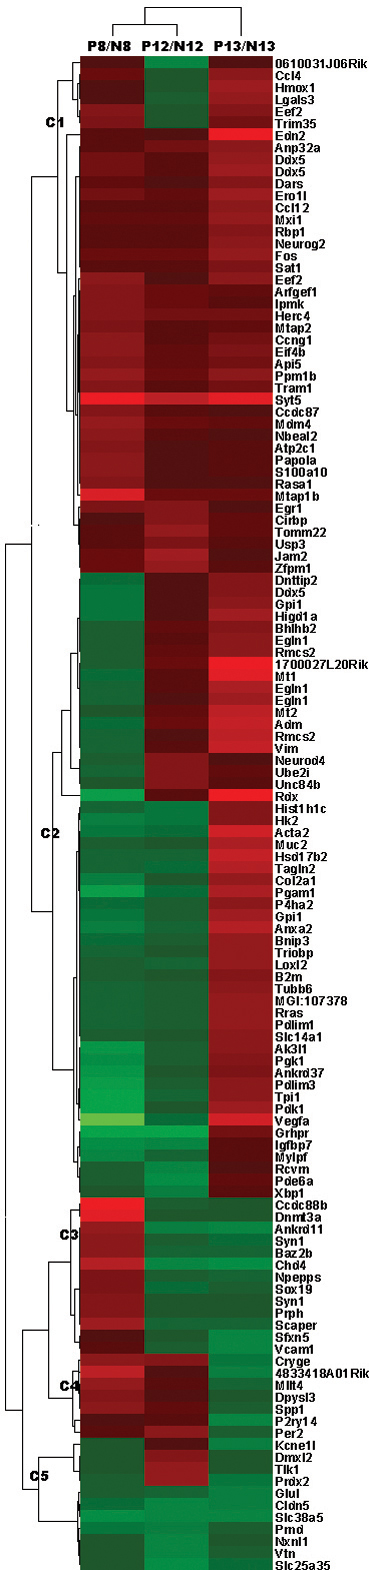
 Figure 5 of
Yang, Mol Vis 2013; 19:775-788.
Figure 5 of
Yang, Mol Vis 2013; 19:775-788.