Figure 4. Statistical analysis of microarray (SAM) plots of four comparison pairs. Three arrays were included in each group. The two
parallel dashed lines are the cutoff threshold specified by the actual false discovery rate, and the total number of upregulated
(red dots) and downregulated (green dots) genes were given for each plot.
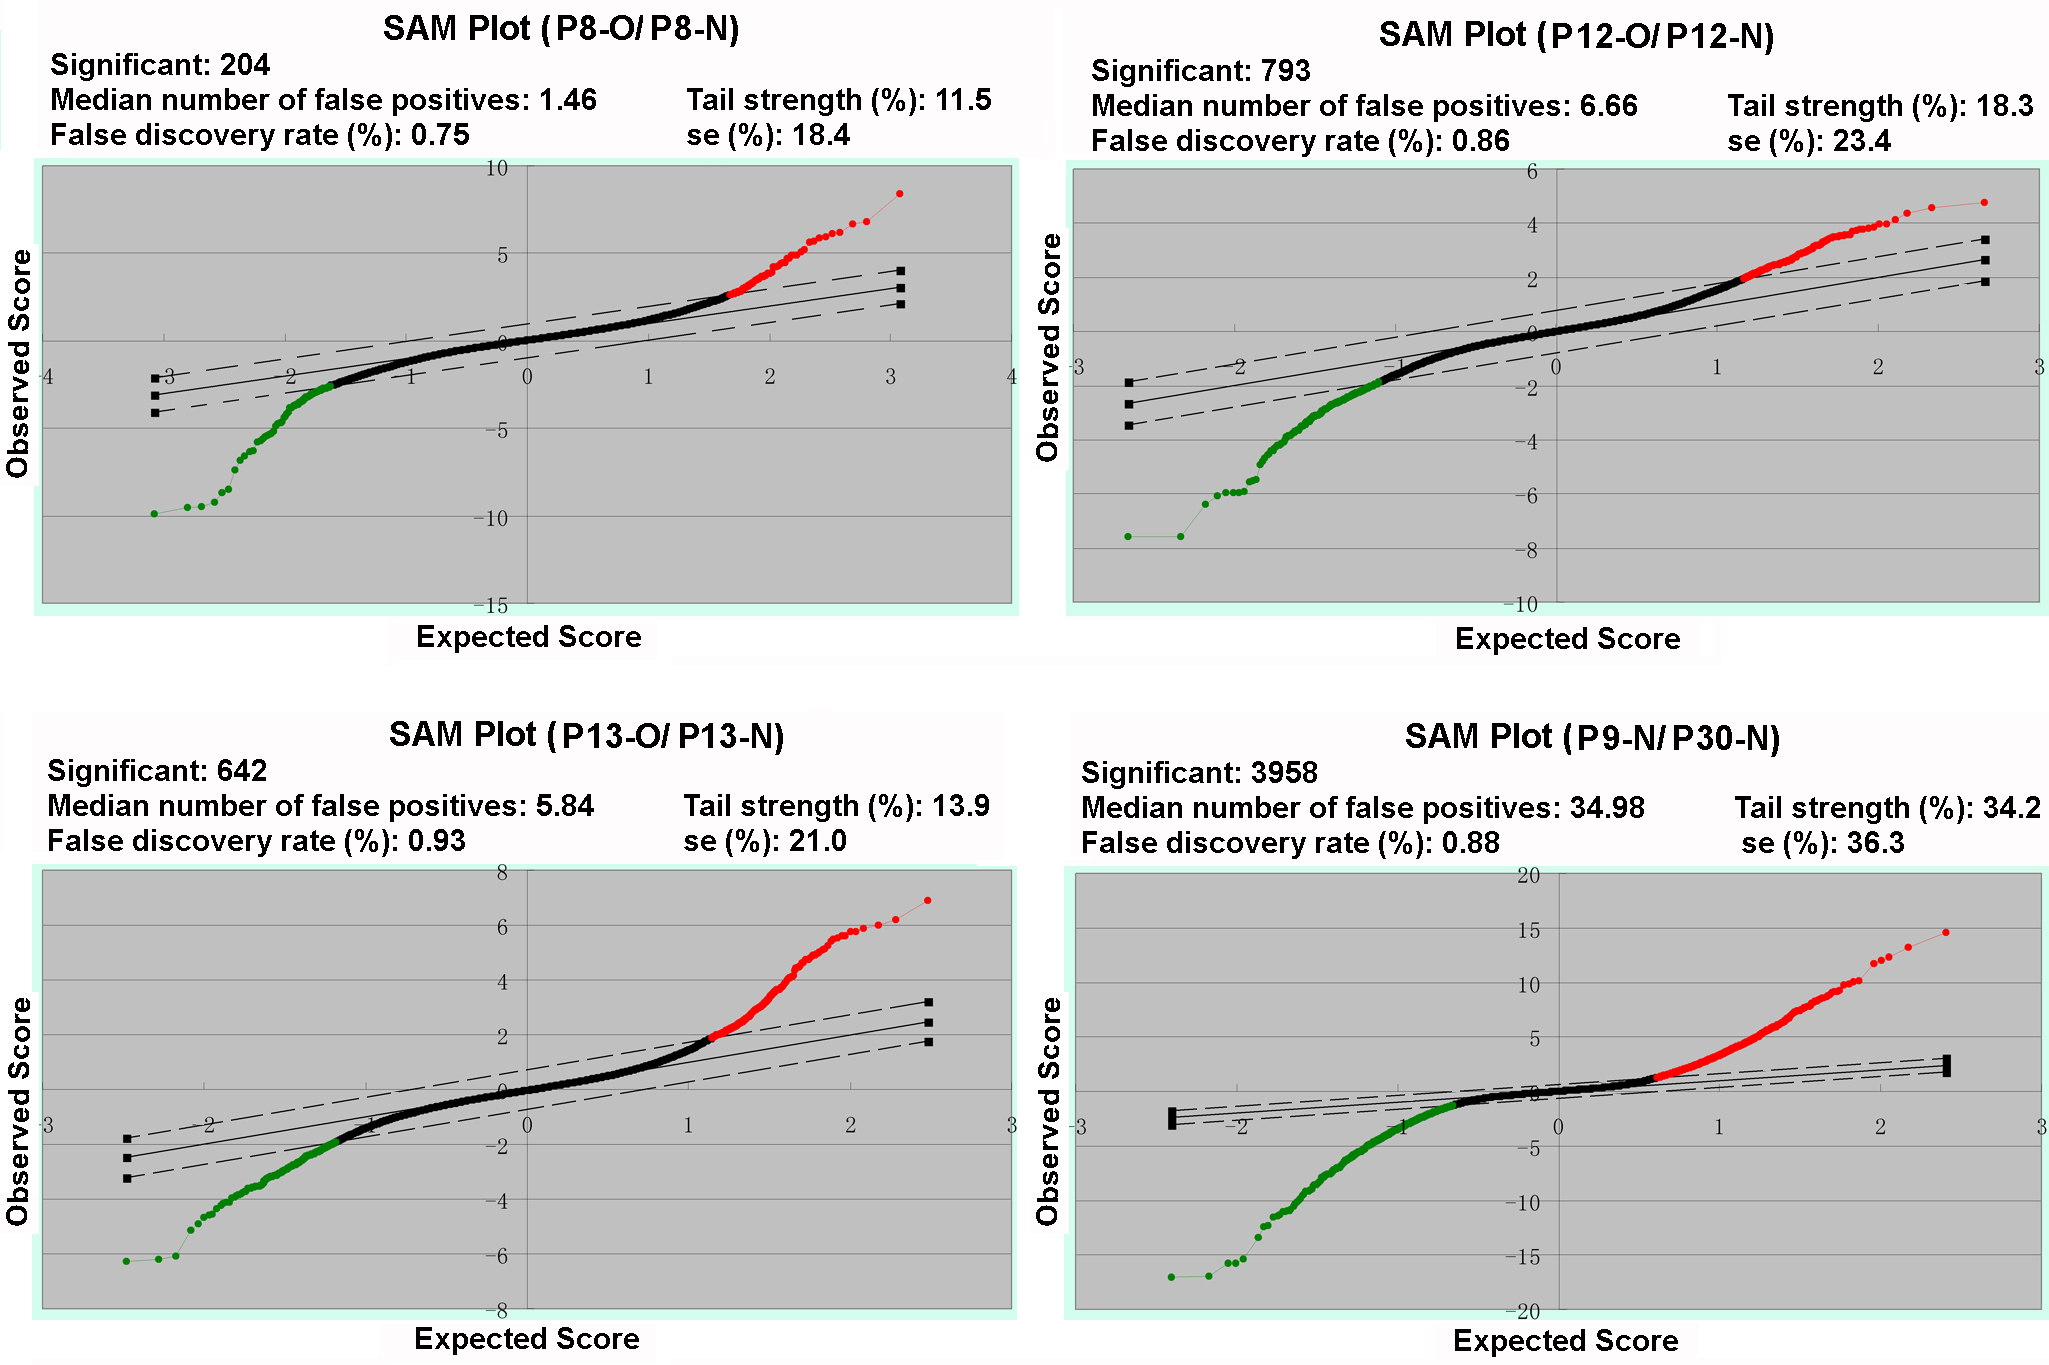
 Figure 4 of
Yang, Mol Vis 2013; 19:775-788.
Figure 4 of
Yang, Mol Vis 2013; 19:775-788.