Figure 2. Clinical examination of two families. A: Comparisons for aortic root diameter measured with ultrasound examinations revealed significant differences between group
MF1 (n=6) and group MF2 (n=3), and between group MF1 and controls (n=5). Error bars represent standard deviation. B: Ophthalmic examination of anterior segments shows a bilateral lens dislocation in individual III:1 of kindred MF2.
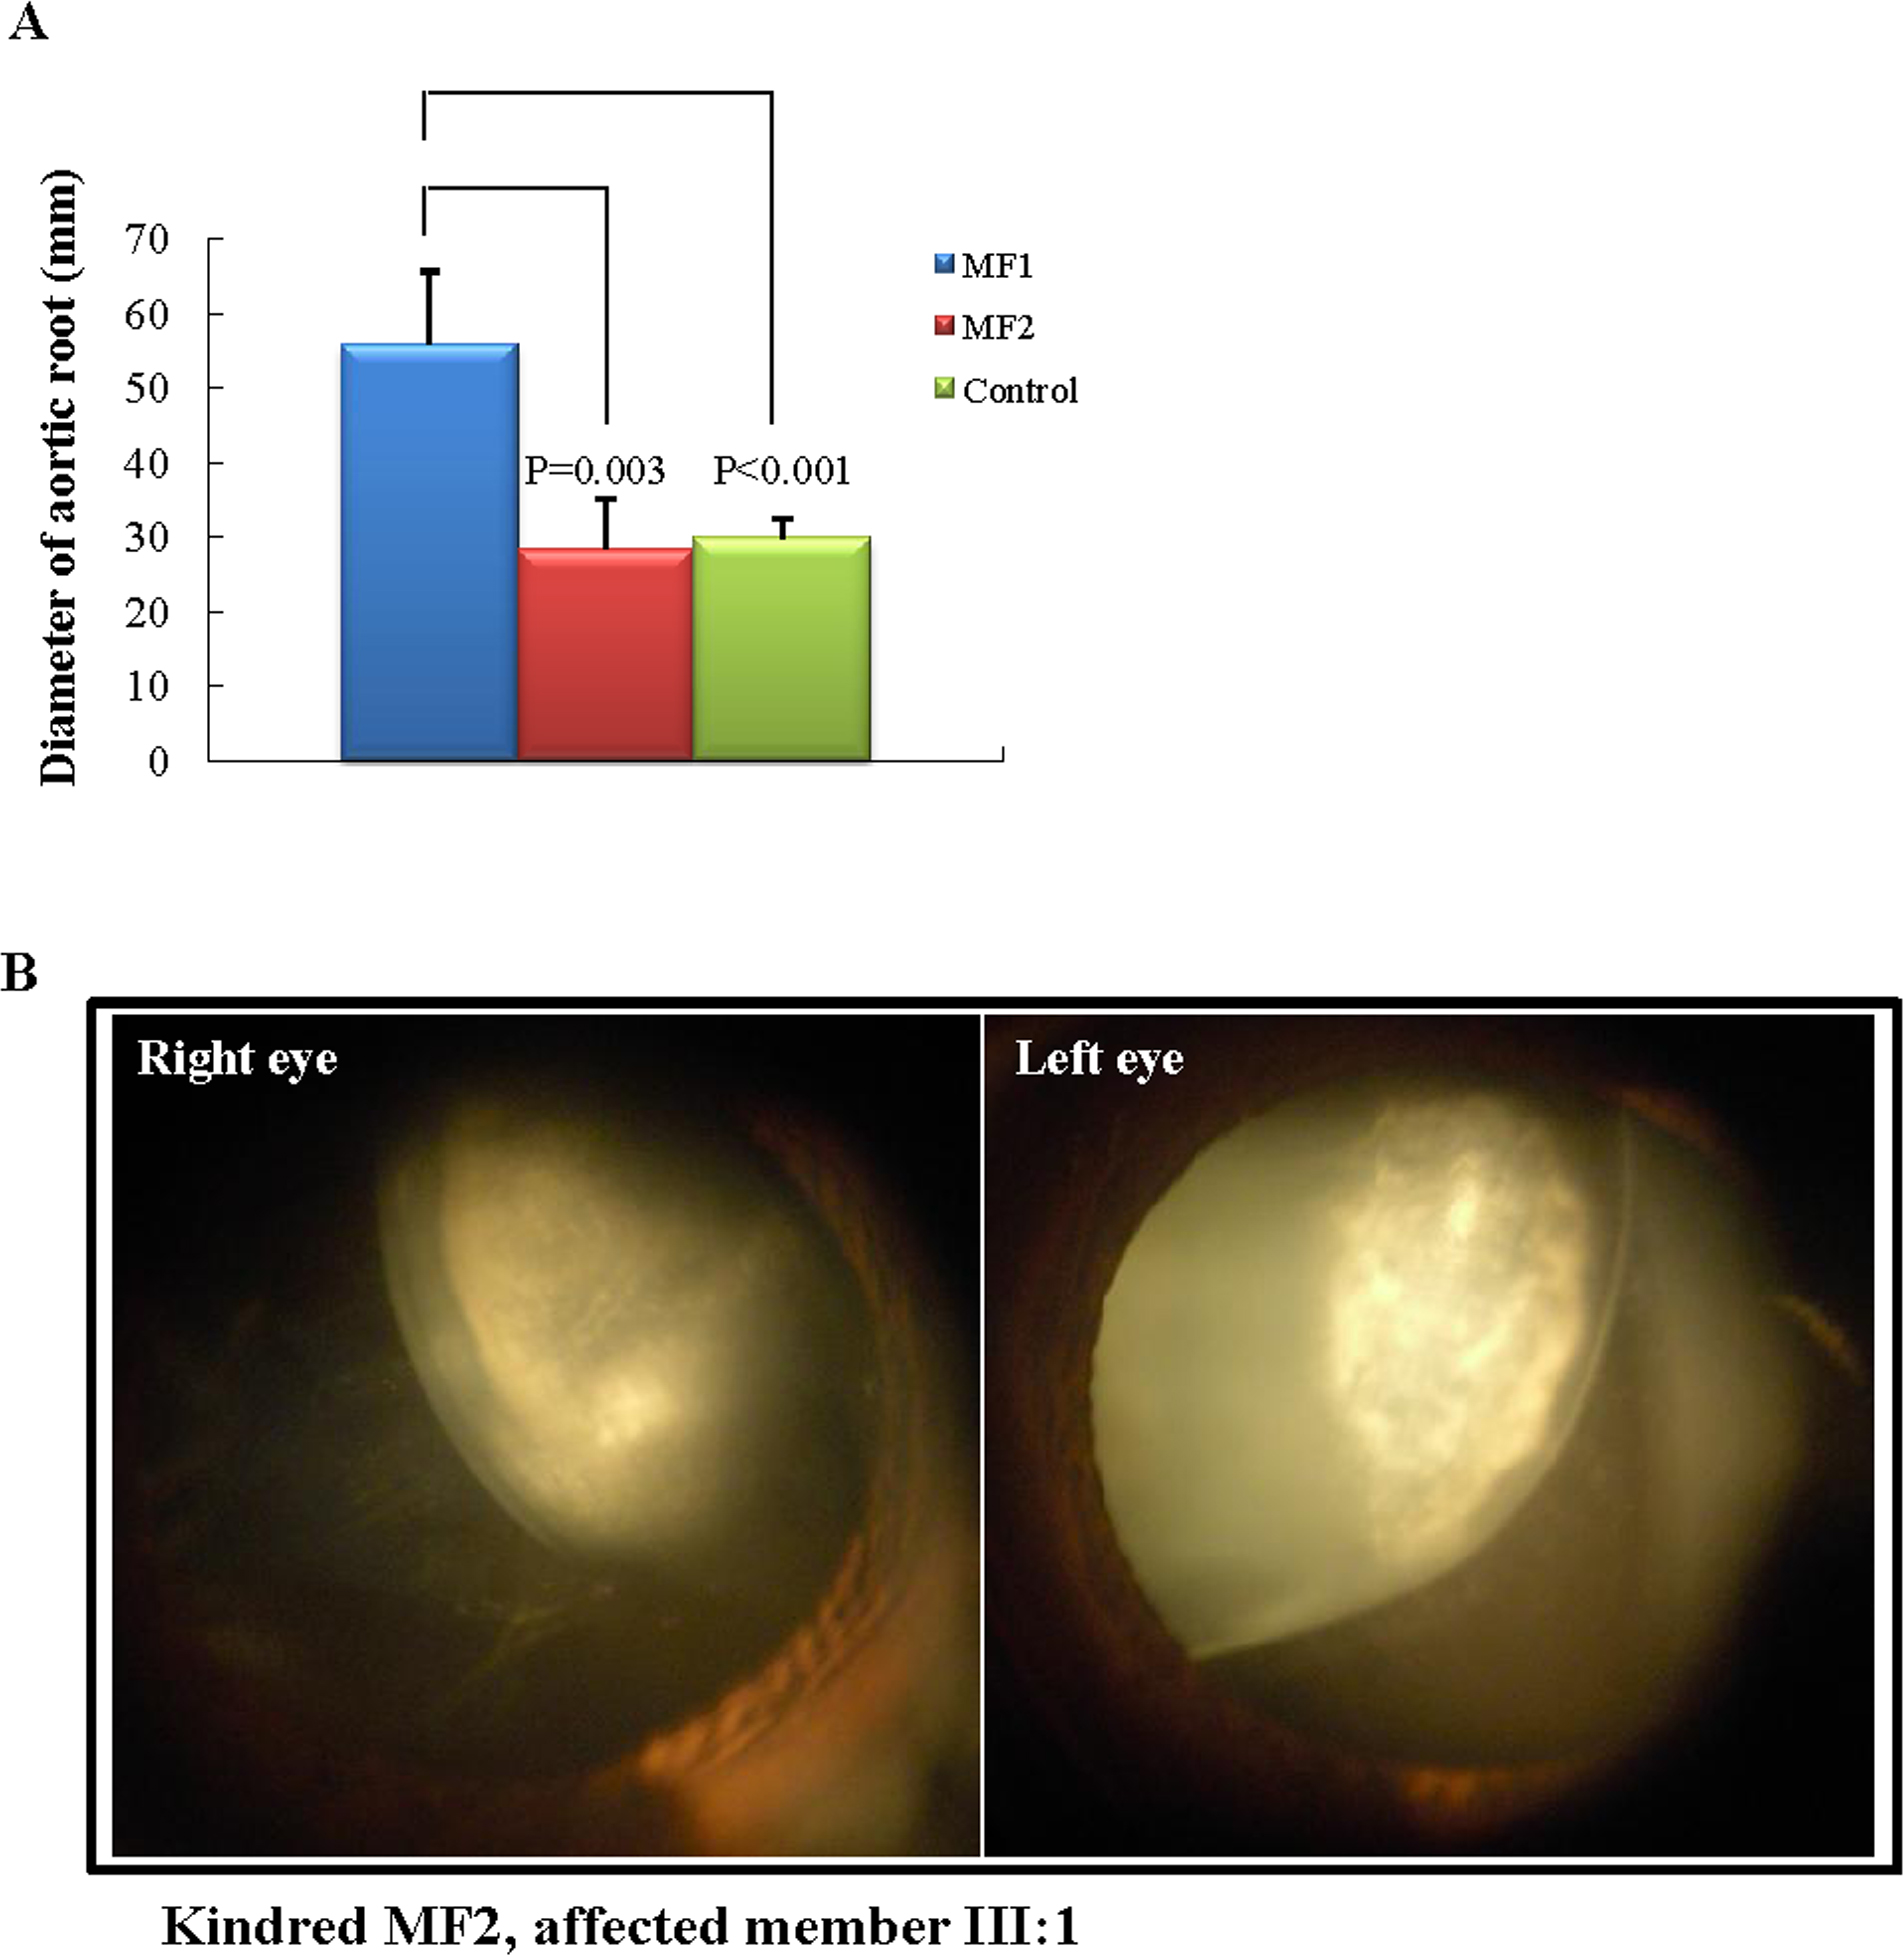
 Figure 2 of
Zhao, Mol Vis 2013; 19:751-758.
Figure 2 of
Zhao, Mol Vis 2013; 19:751-758.